Predicting FIFA World Cup Qatar 2022 Winners
Who is the G.O.A.T.?
What was the greatest national soccer team of all time? Was it Brazil with Pele and Jairzinho around 1970 or Spain in 2010 around Andrés Iniesta, Xavi and Iker Casillas? Soccer (or football!) fans often fiercely discuss which team is better and which is the best, but without data it is just an opinion.
To celebrate the FIFA World Cup Qatar 2022, let’s take a quantitative look at the strength of different national teams over the last 70 years!
A simple model
We start by looking at all international soccer matches, including friendly games, for teams with at least 200 games. (This excludes some teams that haven't consistently ranked well over the time period, such as the national team of Seychelles.) For simplicity, we will just model wins, draws, and losses, and ignore penalty shoot-outs. We translate a win to one point, a draw to half a point for each team, and a loss will give zero points.
For example, in the World Cup final in 2018 in Moscow, France won against Croatia by 4-2; give one point to France and zero to Croatia. As we do, for example, Germany’s 7-1 against Brazil in Belo Horizonte in the 2014 World Cup. Penalty shoot-outs like Italy’s 5-3 against France in the 2006 World Cup finale after Zinedine Zidane’s headbutt against Marco Materazzi in Berlin count as a draw, with half a point to each team, since the regular game ended undecided.
|
Date |
Tournament |
Team 1 |
Team 2 |
Result |
Points Team 1 |
Points Team 2 |
|
2018-07-15 |
World Cup 2018 |
France |
Croatia |
4:2 |
1 |
0 |
|
2014-07-08 |
World Cup 2014 |
Germany |
Brazil |
7:1 |
1 |
0 |
|
2006-07-09 |
World Cup 2006 |
Italy |
France |
1:1 |
0.5 |
0.5 |
How can we now measure the strengths of a team? Strength in soccer is notoriously difficult to assess compared to other sports because it has a much higher level of randomness or noise due to the low number of goals (the primary signal we are interested in). This statistical challenge is further aggravated by the low number of games national teams play compared to the club level.
A simple statistic could just be the number of points made in the last 20 games or so. However, this would not give us any information about teams that didn't play against each other within those last 20 games. Think of Costa Rica with its exceptional goalkeeper Keylor Navas beating Uruguay as well as Italy, and drawing against England, and finally leading Group D in the 2014 World Cup with England and Italy being eliminated). We could also run a logistic regression with all the teams (and opponents) as features, which would make it challenging to include dynamics over time. To account for both relative strengths and dynamic ratings over time, we look at a more sophisticated rating measure: the Elo rating.
Elo ratings
Elo ratings, named for physicist Arpad Elo, and not to be confused with 1970s British rock band ELO, were invented to measure Chess players’ strengths and discourage strong Chess players from only repeatedly playing against weaker ones to accumulate many points. Elo ratings can also be translated into probabilities, and players with similar Elo ratings are equally likely to win.
But how does Elo work? We skip here the formulas because it is quite intuitive: the winning player takes points from the loser, and the number of points they get depends on the difference in rankings. When a higher-ranked player beats a lower-ranked player, they get only a few points, but when a lower-ranked player beats a higher-ranked player they get lots of points.
Let’s look at another example, during the World Cup 2018, in the semi-finals, England lost against Croatia 1-2. England was the favorite to win with an Elo of 1837 against 1757 before the game. This can be translated into a win probability of slightly above 60% for England (ignoring draws). However, in the extra time, Croatia won through a goal by Mario Mandžukić, and Croatia gained 12 Elo points while England lost 12 (Elo changes are symmetric in general).
A big upset was Switzerland’s win against Spain in the group stage of the 2010 World Cup. As we will see in a minute, Spain, the later World Cup winner, had the highest Elo rating at that time and was supposed to win by 84% (again ignoring draws), and lost accordingly 17 Elo points.
|
Date |
Tournament |
Team 1 |
Team 2 |
Result |
Elo Team 1 Before |
Elo Team 1 After |
Elo Team 2 Before |
Elo Team 2 After |
|
2018-07-11 |
World Cup 2018 |
Croatia |
England |
2-1 |
1757 |
1769 |
1837 |
1825 |
|
2010-06-16 |
World Cup 2010 |
Spain |
Switzerland |
0-1 |
1937 |
1920 |
1644 |
1661 |
The best teams in the world since 1960
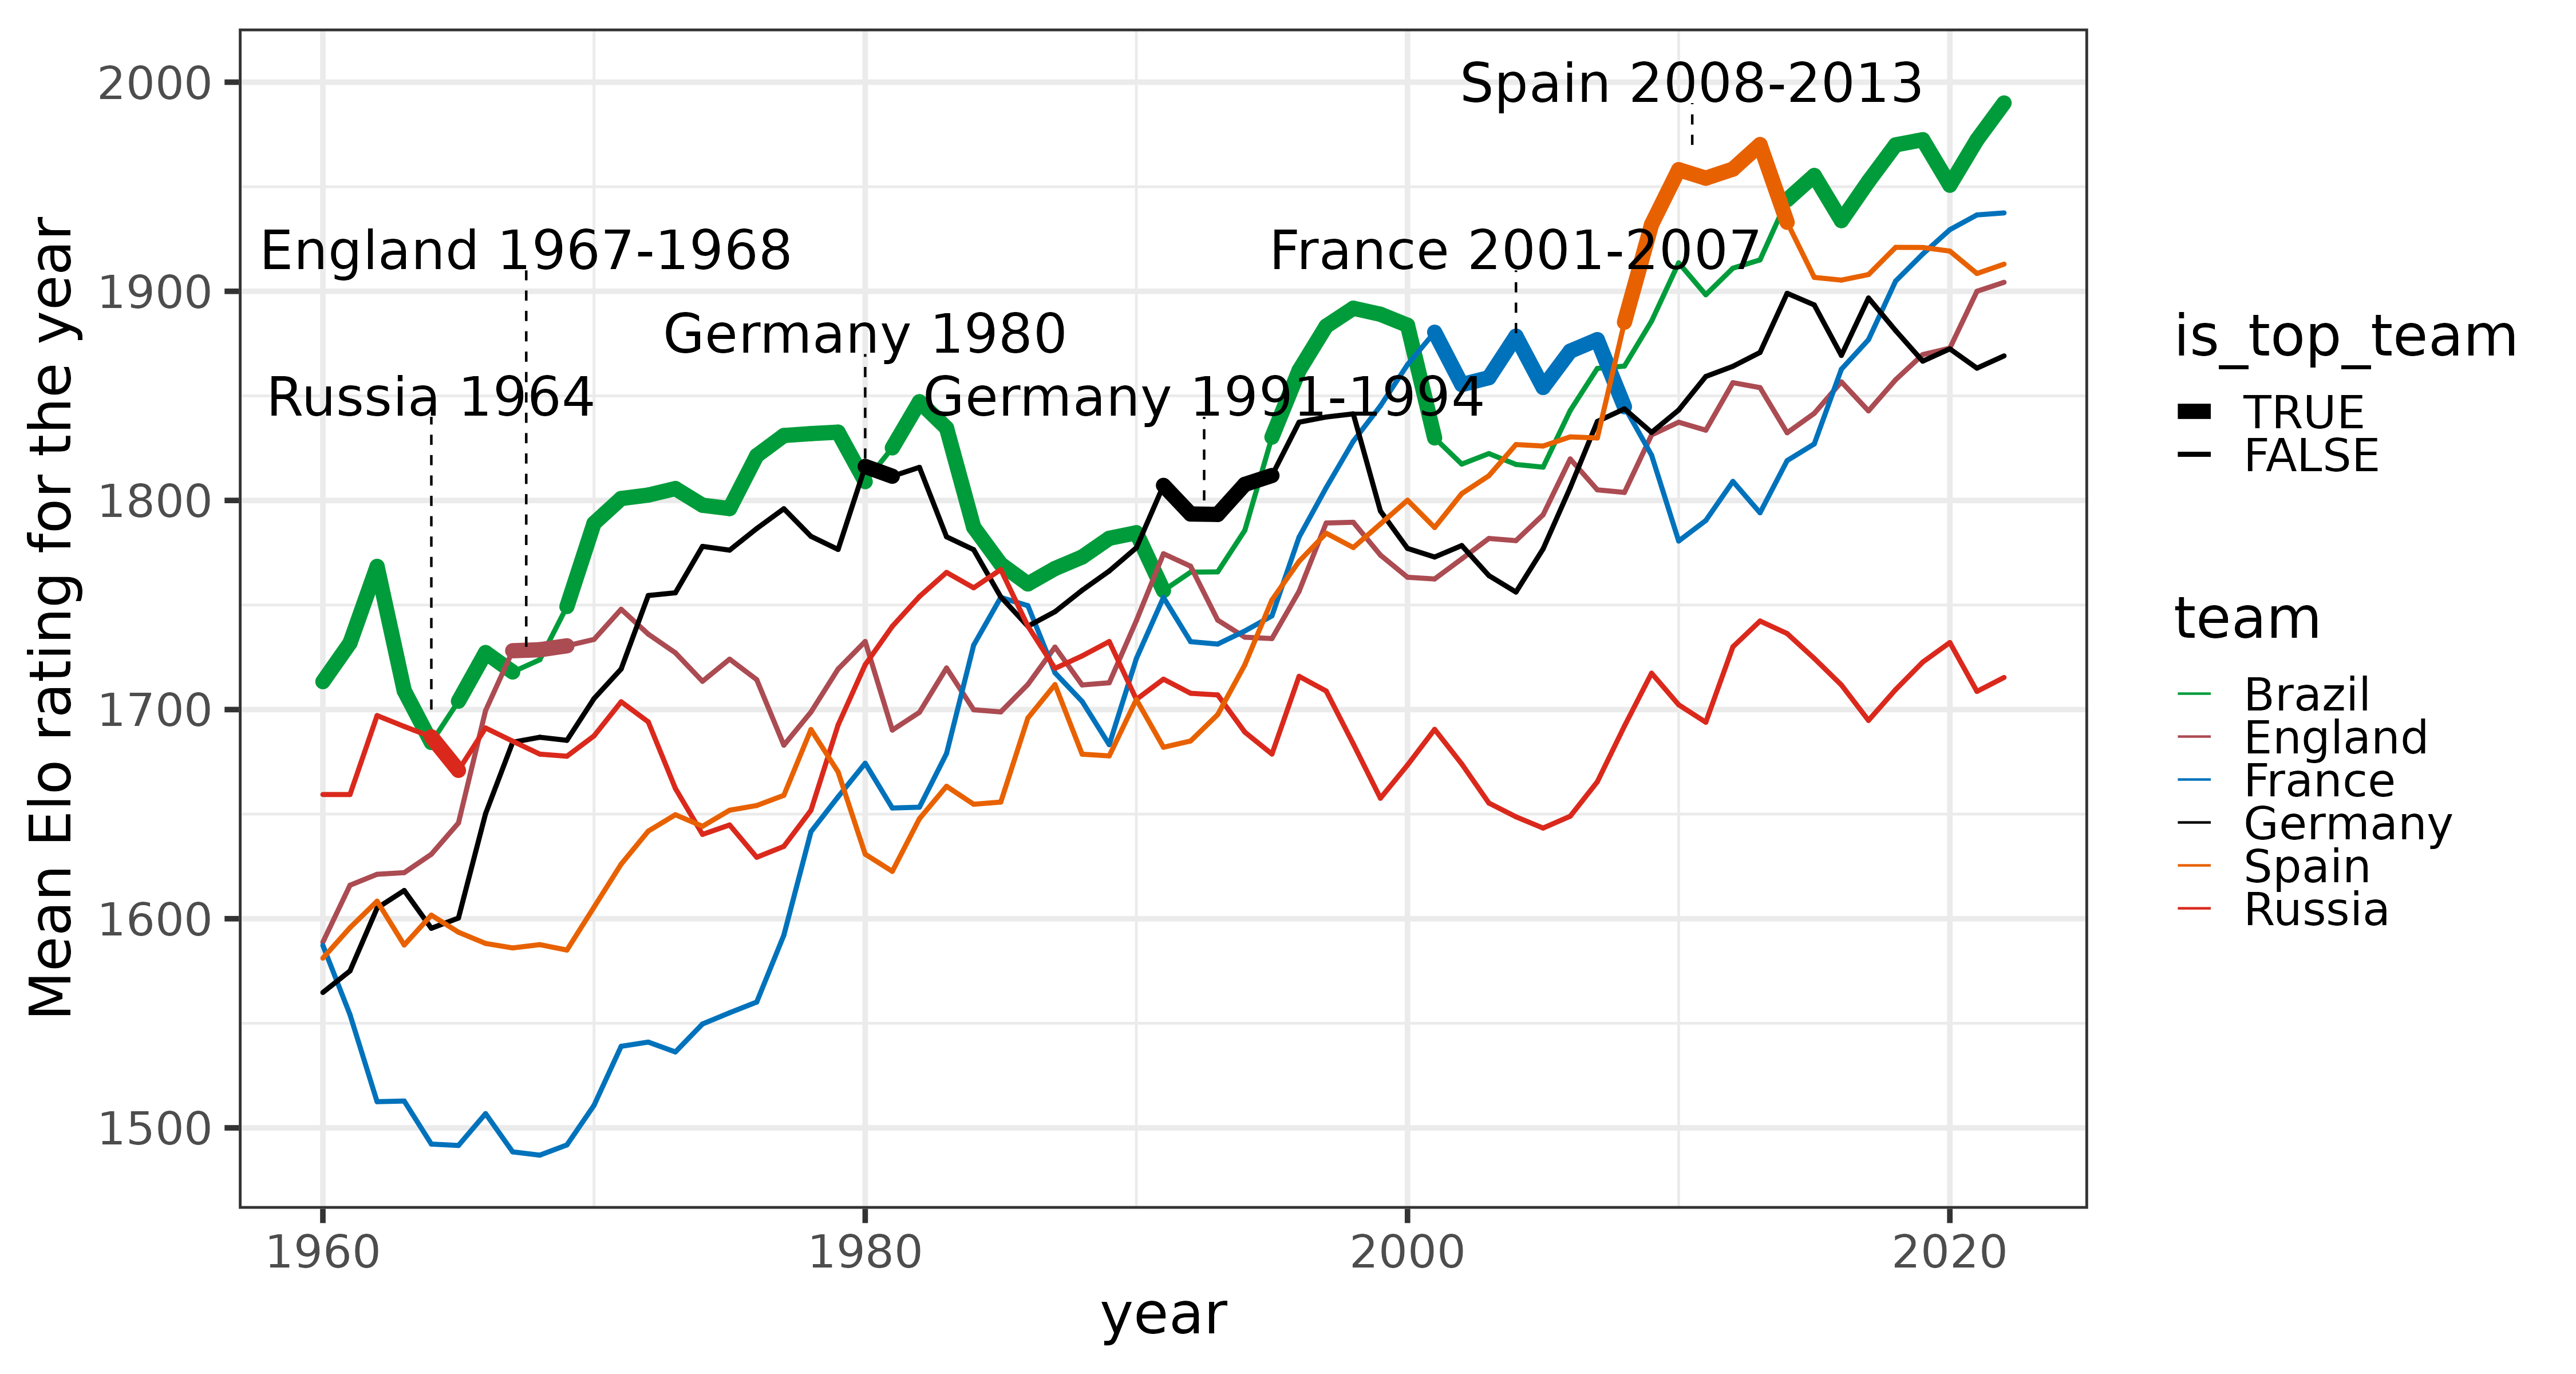
Now let’s look at the best teams over time according to the Elo rating. We use the 1950s to calibrate the ratings and start in 1960. As you can see in the following graph, Brazil dominates the soccer world, being top for 42 of the 63 years considered. Apart from Brazil, only 5 other teams made it number one. Russia—around its legendary goalkeeper Lev Yashin—for one year in 1964. Germany in 1980, when they won the Uefa Euro tournament and following the World Cup win in 1990, captained by Lothar Matthaeus. France, following their Uefa Euro 2020 win between 2001 and 2007 with players such as Zinedine Zidane or Thierry Henry. They were taken over by Spain in 2008, which won three consecutive titles between 2008 and 2012 (including the World Cup in 2010). Diego Maradona’s or Lionel Messi’s Argentina never made it top according to this rating, and neither did Johan Cruyff’s Netherlands in the 1970s.
The Elo ratings go consistently up. That might be partly the result of better soccer talent identification and better training, but it is also a well-known fact Elo ratings tend to inflate over time (yes, inflation is everywhere nowadays). There are different means to augment Elo to take this inflation into account, but this is beyond the scope of this article.
If you wish to recreate this plot yourself, then open the DataCamp Workspace used to prepare the data and draw the plot.
Who will win the World Cup in 2022?
Finally, looking at the upcoming World Cup in Qatar, which teams are most likely to bring the trophy home? Looking at the most recent Elo ratings gives a sense of the current performance.
|
Team |
Current Elo rating |
|
Brazil |
2000 |
|
Argentina |
1944 |
|
Spain |
1915 |
|
France |
1906 |
|
Belgium |
1897 |
On Top is since 2013 Brazil again with a rating of 2000, followed by Argentina, Spain, France, and Belgium. Even this simple model—which does not take into account how easy or hard the group stage is for each team—lines up reasonably closely with bookmaker's predictions, who also have Brazil as the most likely winners.
If Brazil meets Argentina in the final, our Elo model predicts that Brazil would be slightly favored with a 58% chance to win.
Keep learning
If you are interested in making predictions using data, try one of the machine learning scientist career tracks.
If you made it up to this point, and you are still interested to learn more about Elo ratings and soccer, you can take a look at this article in the International Journal of Forecast that also describes how Elo ratings can be used as features for other models: Using ELO ratings for match result prediction in association football.
Become a data analyst
DataCamp Tracks help you develop your career in data science faster.


How to Learn Machine Learning in 2024

Adel Nehme
15 min
OpenCV Tutorial: Unlock the Power of Visual Data Processing

Richmond Alake
13 min
An Introduction to the Mamba LLM Architecture: A New Paradigm in Machine Learning

Kurtis Pykes
9 min
A Beginner's Guide to Azure Machine Learning

Moez Ali
11 min
ML Workflow Orchestration With Prefect

Abid Ali Awan
How to Transpose a Matrix in R: A Quick Tutorial
Adel Nehme