Course
Introduction to Python
4 hr
5.5M
The "R vs. Python" language war has a long history. As the defacto programming languages for data science, they attract different supporters from many domains. As a result, practitioners don’t take full advantage of what both languages offer and limit themselves to mastering one tool only. However, learning to use both R and Python as a bilingual data scientist can help you better solve any problems you may encounter in your career.
As Python grows in popularity, more and more R users are switching to Python. So, if you are an R user, consider this article as an overview of Python libraries that you can integrate into your daily workflow. Some have R-like syntax for a smooth switch, while others bring more functionality and speed.
R has a rich ecosystem of data manipulation libraries. Be it dplyr, tidyr, or data.table, R users enjoy a wide variety of tools at their disposal. However, they might consider switching to some Python alternatives for more flexibility, speed, and features.
Chief amongst the Python data manipulation packages is the pandas library. It is the premier data manipulation package in the Python data science stack and is used by millions worldwide. It currently has over 20 million weekly downloads, making it one of the most popular Python packages.
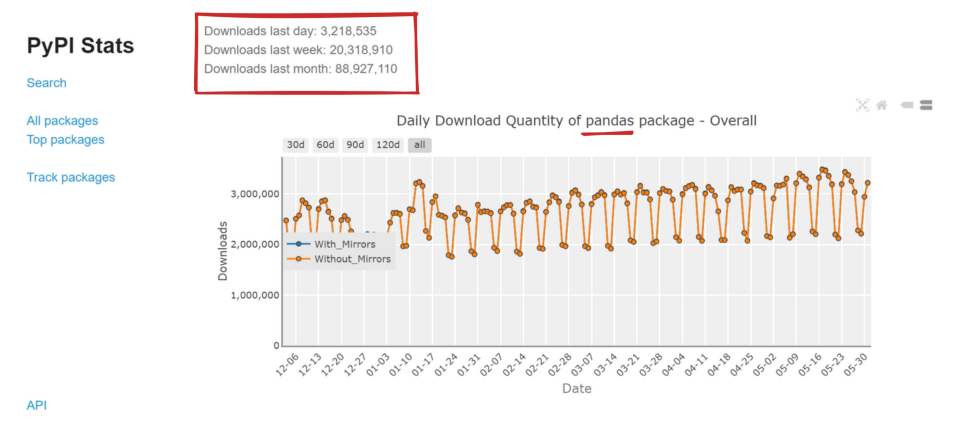
pandas download stats from PyPI Stats website.
It offers such an extensive suite of functions and classes to work with data, that you can still find yourself learning new techniques with pandas despite years of experience. pandas is also a keystone library in the ecosystem, as many other Python libraries mentioned in this article are written so that their functionality aligns with pandas' classes.
Even though it is such an extensive library, it is simple to learn and master. Knowing a few classes and functions allows you to perform complex analyses on any dataset.
If pandas’ syntax looks too unfamiliar to R users, they might feel right at home using the Python datatable package. It is inspired by its R counterpart and written solely to deal with today's massive datasets, and it can read and manipulate gigabyte-sized files in mere seconds.
An everyday use case is to read a large dataset with datatable and convert it to the pandas DataFrame format, which is much faster than reading it purely with pandas. But, as an R user, you don't even have to do that as datatable has almost the same syntax as the data.table package of R.
R users looking to switch to Python can also benefit from improved performance due to widespread GPU support for Python libraries. RapidsAI offers just that opportunity via the cuDF library. cuDF is a dataframe library that lets you manipulate datasets with billions of rows by tapping into the computing power of NVIDIA GPUs. Another advantage of cuDF is that it has a similar syntax to pandas.
R’s ggplot2 sets the standard for data visualization packages and is among data science's most widely used libraries. However—for any R user looking to switch to Python for data visualization—there are a lot of worthy alternatives.
Matplotlib is one of the first libraries people are introduced to when they start learning data science in Python. It is one of the rare libraries that balance complexity and flexibility perfectly. In other words, it is easy for beginners to learn to create great charts while also having all the tools experienced users need to create truly amazing custom plots.
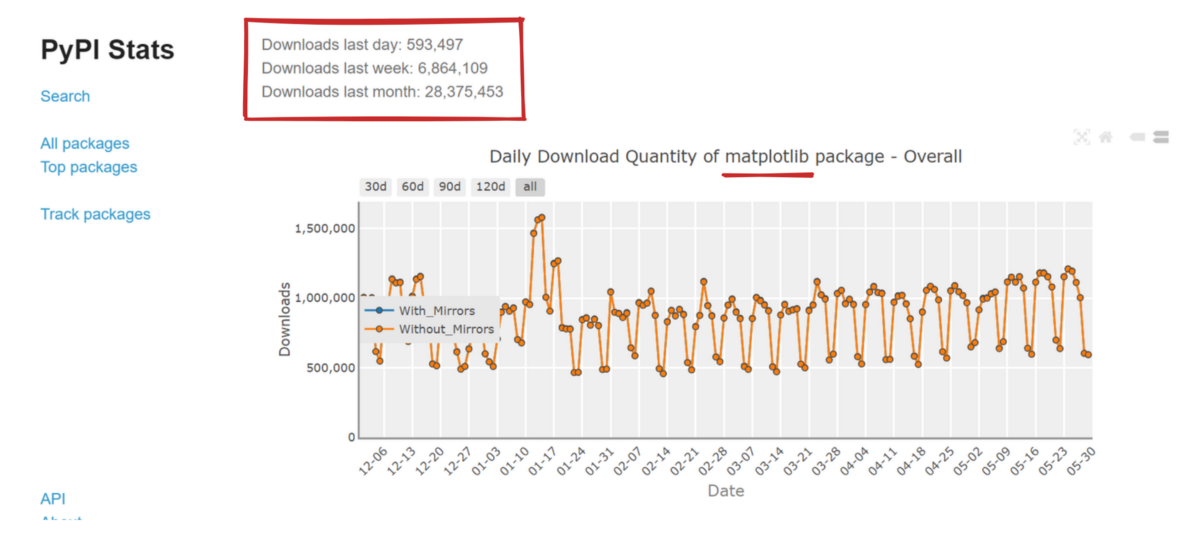
Matplotlib download stats from PyPI Stats website.
The drawback of Matplotlib is that plots require a great deal of customization. However, for easily styled plots, you can check out Seaborn. It is a wrapper API around Matplotlib, making it considerably easier for beginners to create highly aesthetic plots. Seaborn also introduces new plot types and sub-plotting tools that aren't readily available in Matplotlib.
Python also allows you to create interactive data visualizations using a range of interactive data visualization libraries. Most notably is Plotly, which has deep roots in R as well. It is excellent for producing high-quality interactive charts and provides interfaces to customize and create complex plots.
Moreover, Python’s Dash framework is built on top of Plotly and allows you to create beautiful web apps for hosting dashboards easily. Another Python library that lets you easily create interactive plots is Bokeh, which also allows you to deploy visualizations as web apps easily.
For anyone looking for a natural ggplot2 alternative in Python, the plotnine package offers an implementation of the grammar of graphics in Python. It has extremely similar syntax and aesthetics as the ggplot2 package and provides a seamless experience for R users looking to start visualizing data in Python immediately.
Native Python doesn’t come loaded with a host of statistical functions like R. However, its libraries more than make up for this shortcoming.
The first one is the mighty NumPy, which carries many other essential Python packages on its shoulders. It is a superb array manipulation library with a rich selection of vectorized math functions. Its speed in matrix manipulation is perhaps only rivaled by Julia, one of the fastest languages in programming history.
NumPy's n-dimensional arrays are the backbone of other important computational libraries like TensorFlow or PyTorch. For this reason, NumPy's download stats are much higher than that of pandas and Matplotlib combined.
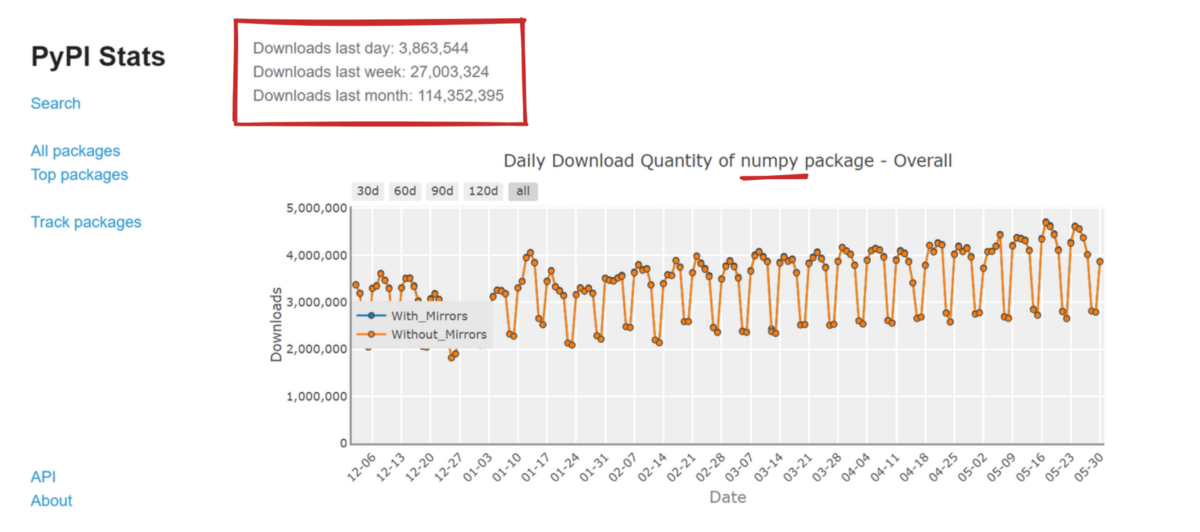
Numpy download stats from PyPI Stats website.
If you can't find a function in NumPy, SciPy is the answer. It has separate sub-modules for various computational applications in math, physics, and statistics.
Its special functions module contains essential speed-optimized mathematical physics functions for researchers. You can solve optimization problems using its optimization module while its integrate and fft modules take care of calculus, and Fourier transforms. Its linalg module contains everything in NumPy's linalg module plus more advanced and niche linear algebra functions. This module has excellent support from BLAS/LAPACK (standard base software libraries for linear algebra), making it even faster than NumPy.
It can also let you process multi-dimensional images efficiently. While NumPy is great for 2-D/3-D images, it can't easily handle higher-order images from fields such as medicine and biology. This is where you can use SciPy's ndimage module.
While the above packages revolve more around maths than statistics, Python also offers the statsmodels library. It is a vast library with functions and classes that allow you to estimate many statistical models, conduct hypothesis tests, and explore data.
There are entire functions for regression analysis and mature APIs for generalized linear models. Its Time Series Analysis module is especially handy, as it contains specialized functions to perform and visualize time series.
Its other modules can be used for survival and duration analysis, nonparametric methods, and multivariate statistics. And to R users' delight, most of these mentioned modules use R-like syntax in both writing functions and printing their output. For pure statistical analysis, statsmodels is the perfect combination of NumPy, SciPy, and Matplotlib.
This is the area where R users might find the most value in picking up Python. Python’s machine learning libraries are much more holistic than R’s and provide many algorithms and tools for data pre-processing, feature engineering, hyper-parameter tuning, modeling, and more.
The first such framework is scikit-learn. It is the most popular machine learning framework in Python and is used by most machine learning practitioners today.
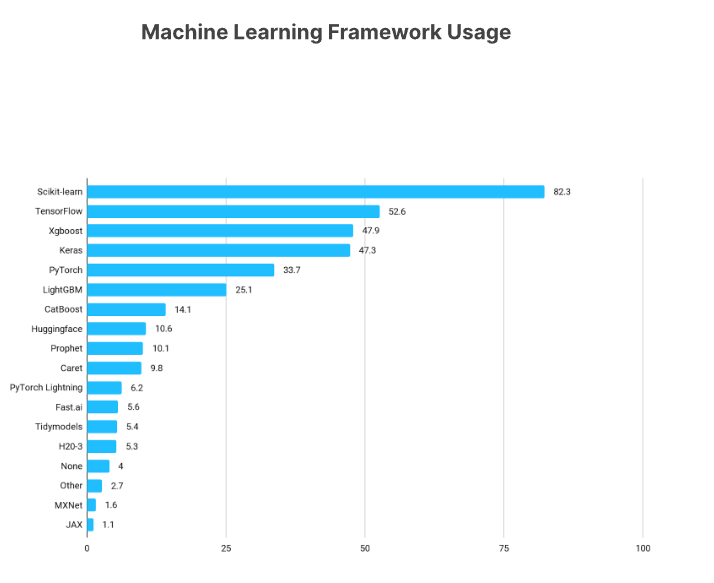
From Kaggle’s State of Data Science and Machine Learning Survey 2021
Scikit-learn has a vast selection of supervised learning algorithms for regression, binary, and multi-class classification. It has dedicated sub-modules for data preprocessing, pipelines, dimensionality reduction, feature engineering, feature selection, missing data imputation, and clustering.
Despite its massive number of classes and functionality, it has a highly intuitive and straightforward API. Scikit-learn does a remarkable job implementing all 20 Python code design patterns in the Zen of Python.
If scikit-learn has a drawback, it would be its lack of GPU support. All its algorithms run on CPU, so naturally, people turn to other frameworks when they need more computation speed with GPU-enabled libraries. One such library that R users are already familiar with is XGBoost.
With state-of-the-art GPU-powered Gradient Boosted Trees at its core, it can solve supervised learning tasks much faster than other machine learning frameworks with high-performance levels. The above image shows that it is quite popular among the Python community and dominates tabular competitions on Kaggle.
Two similar libraries are LightGBM and CatBoost. While LightGBM requires significantly fewer memory resources than XGBoost, CatBoost provides speed and accuracy advantages. All three gradient-boosted libraries can implement the Scikit-learn API, making them very easy to use.
While R and Python enjoy different advantages, framing it as a “language war” is counter-productive for data scientists. In their recent appearance on the DataFramed podcast, authors of "Python and R for the Modern Data Scientist" Rick Scavetta and Boyan Angelov speak about the advantages of being a bilingual data scientist and how modern data teams would benefit from bilingual practitioners.
Throughout the podcast, they discuss how a key drawback of the language wars framing is the rise of monocultures thinking within the R and Python communities. One of the best counter-arguments to monoculture or the "us versus them" mentality is the "hammer and nail" analogy — if all you have is a hammer, everything looks like a nail.
In other words, the language-first approach limits your creativity and ability to solve problems effectively. By taking a solution-first approach, you start to look at the solution of your problem in terms of concepts rather than sticking to what is rigidly offered in a single language.
Knowing both R and Python enables you to use the best of both worlds appropriately in contexts where one is superior to the other. For example, the authors state how R shines in data visualization with ggplot2 and how mature its reporting ecosystem is with the help of R Markdown and Shiny while highlighting how Python excels at machine learning, APIs, and MLOps.
The authors outline a brilliant case study in the book that shows how you can make both languages communicate with each other. Using tools like reticulate in RStudio, you can call Python scripts and run Python packages within R, allowing you to freely pass objects between the languages.
Becoming a bilingual data scientist has never been easier if you are an R user. For more on learning Python, you can check out our extensive collection of resources.
Related courses
Course
Course
Course
Adel Nehme
Amberle McKee
Adel Nehme
Bex Tuychiev
Adel Nehme
Adel Nehme