HomeBlogTableau

What can you do with Tableau?

Ever wondered what you can do when you master Tableau? We explore the potential uses for this versatile tool. Start your journey to Tableau mastery today
Updated Jul 2022  · 3 min read

What can you do with Tableau

Many businesses have long forgotten about manual spreadsheets. What was once a laborious task is now transformed into a fast and intuitive one, thanks to business intelligence tools such as Tableau.

So how did Tableau transform spreadsheet-making from a daunting task that people avoided to a popular job that is enjoyable and interactive? First, tableau’s inclusive platform makes it easy for anyone to use it. Additionally, with Tableau, you do not need any prior data science or technical skills to make the most out of the platform. Instead, you can start turning raw data into actionable intelligence with relative ease. Check out some of the things you can do when you master Tableau with the examples below.

What Can You Do When You Master Tableau For Data Analysis?

1. Visualize your data with beautiful no-code plots and charts

Visualize data with no-code plots and charts gif

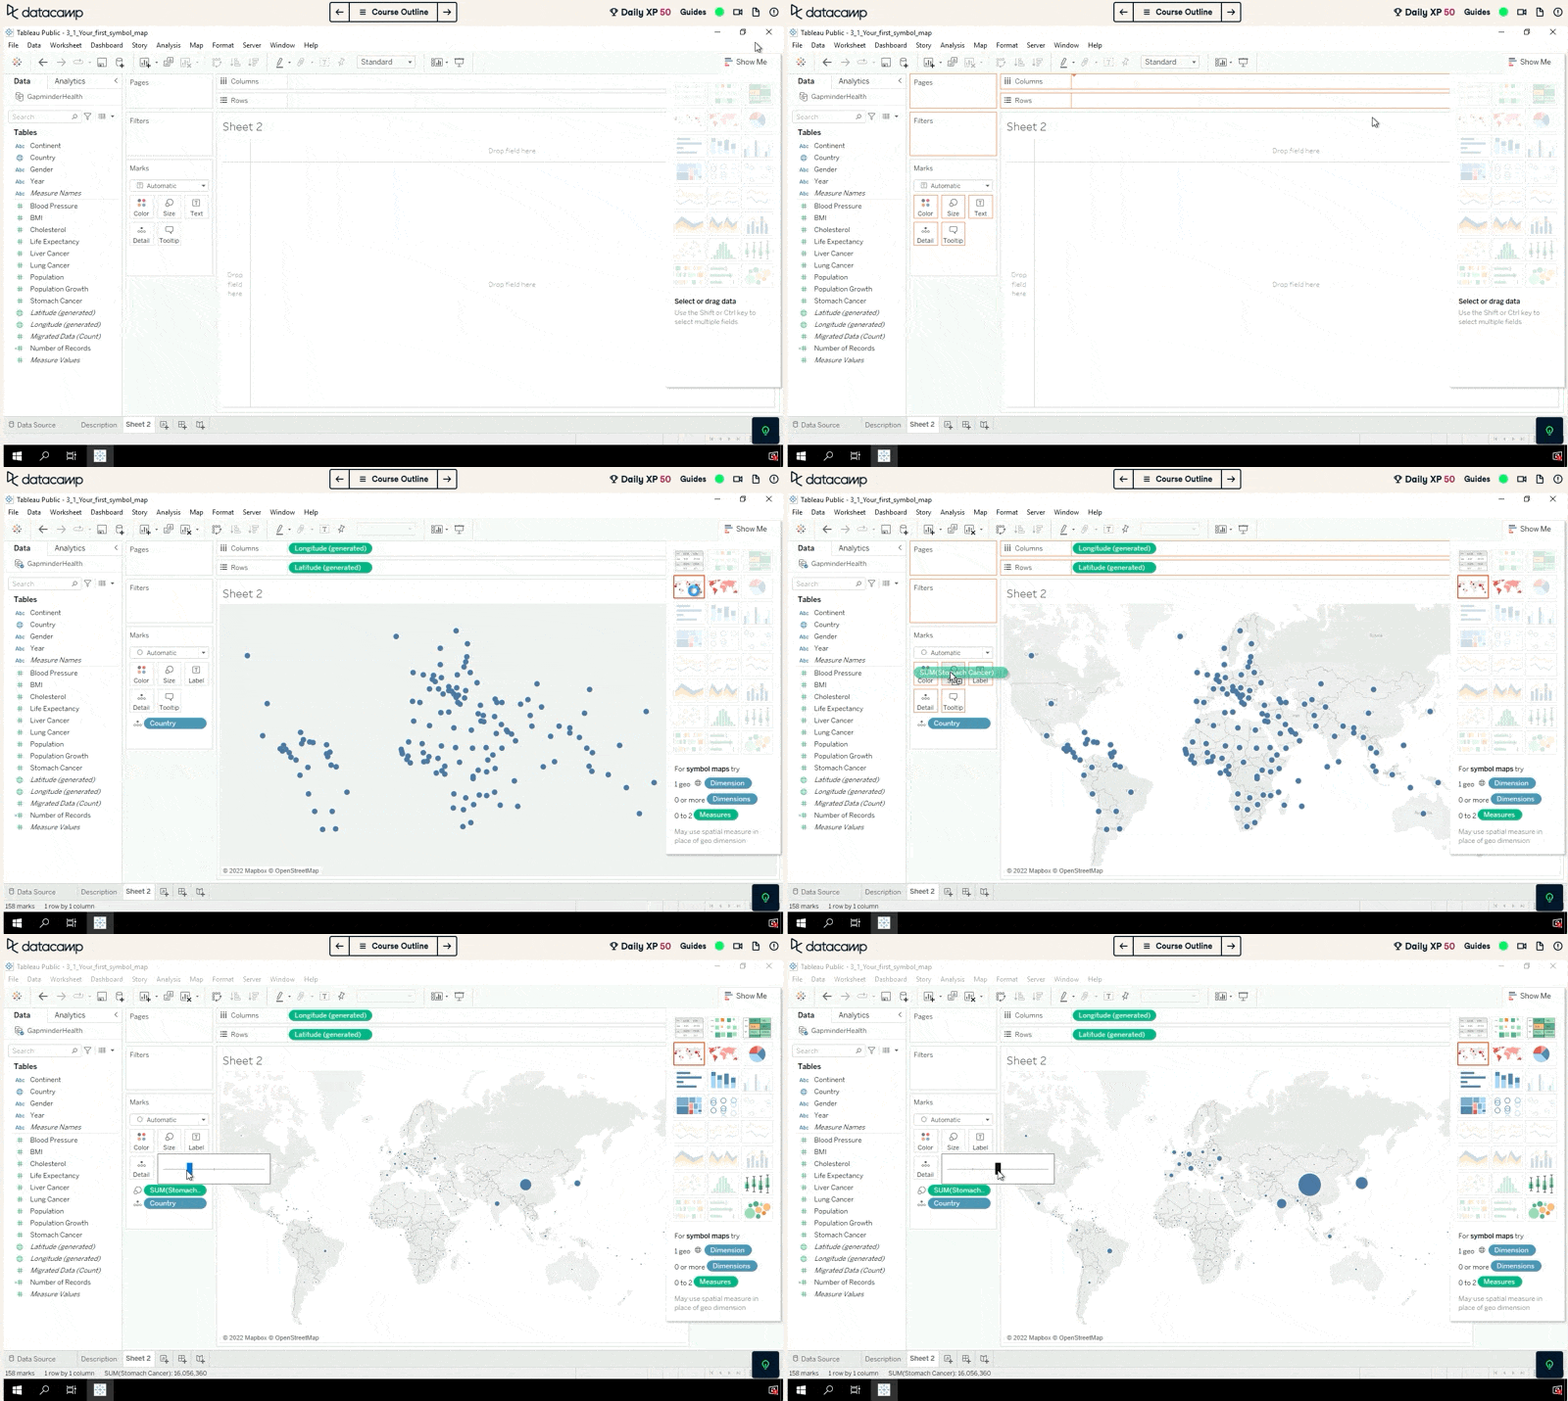
Tableau's plotting and charting tools are powerful and easy to use and require no coding at all. From traditional plots like bar plots and line plots to business focussed charts and gauges, Tableau has it all. By mastering data visualization in Tableau, you’ll be able to create beautiful, customizable charts, and create impact with your analysis. 

How to get started

2. Manipulate, transform, and calculate on your data

Manipulate, transform, and calculate on your data gif

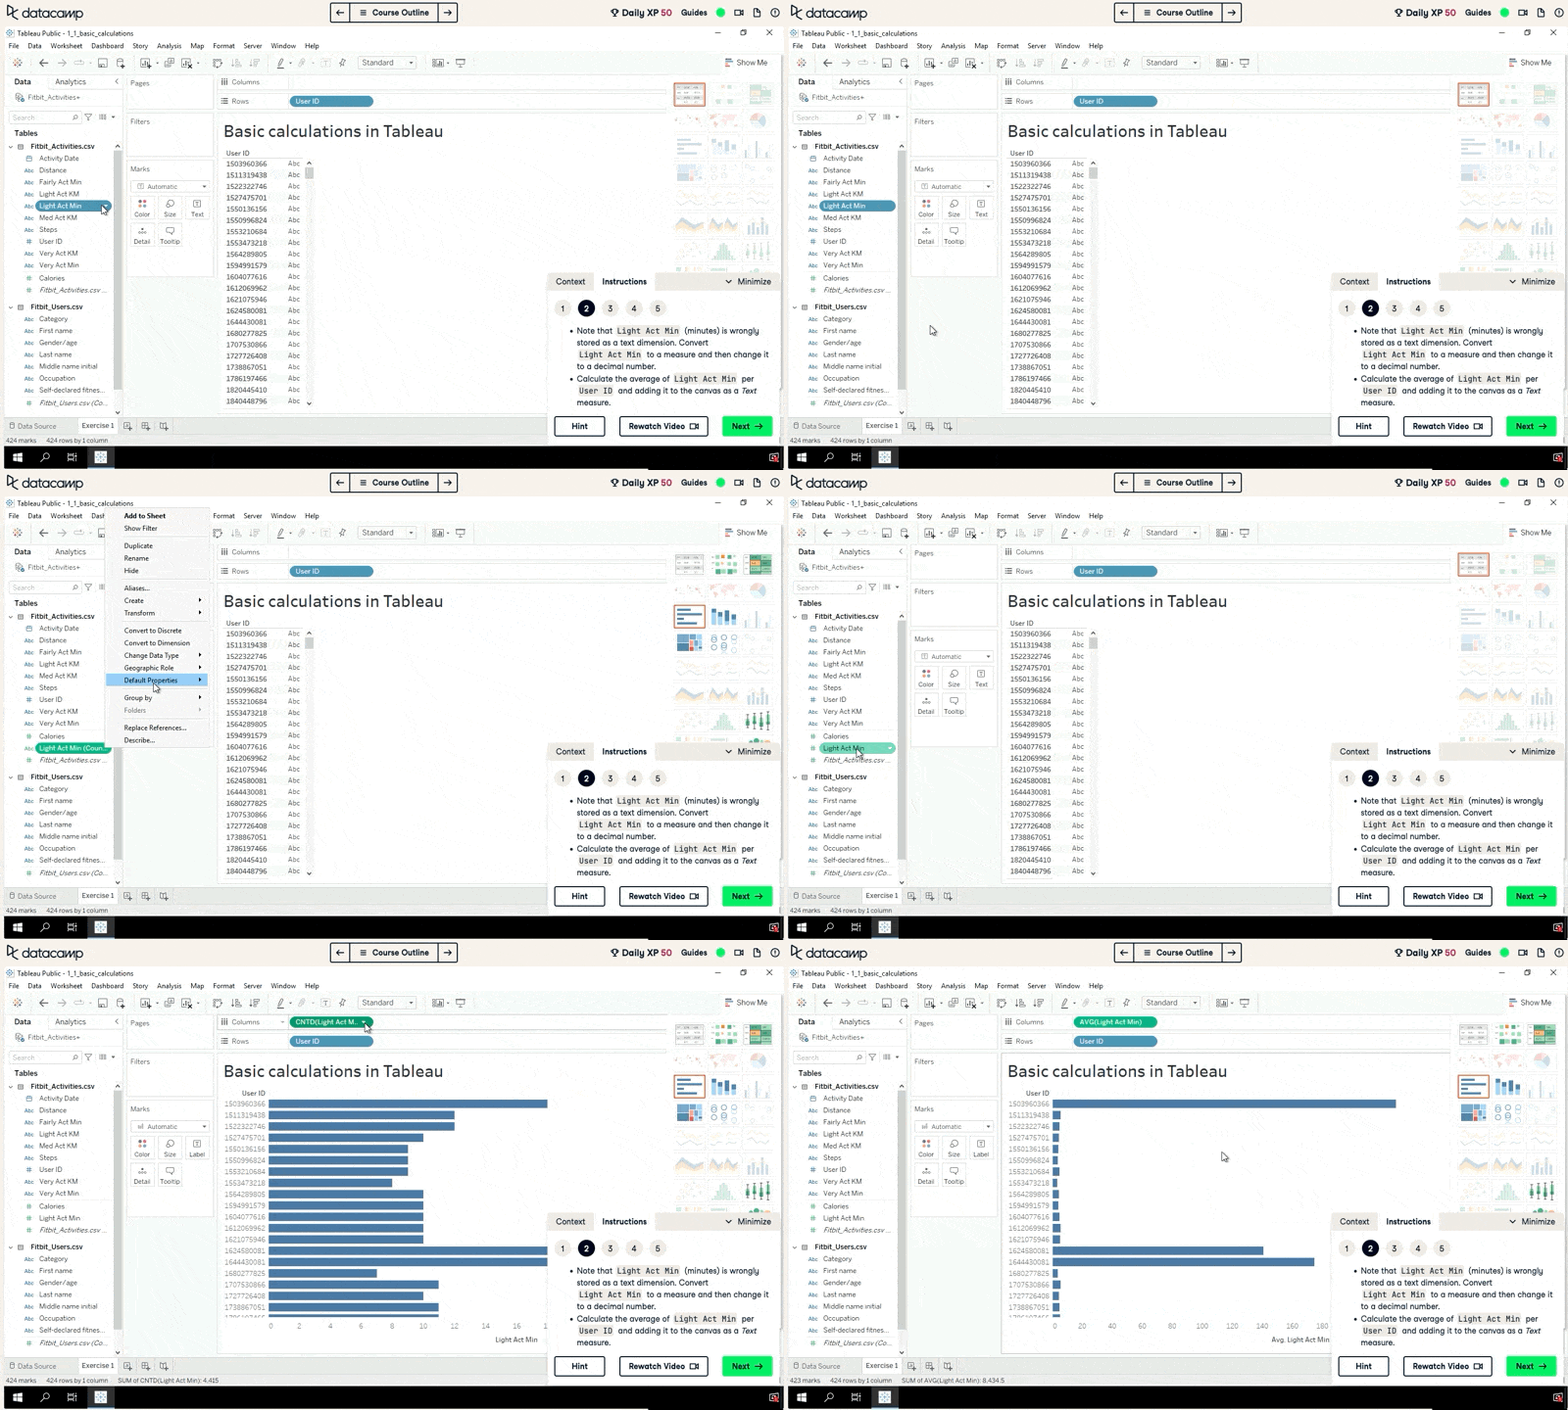
As every data analysts know, data is never in the format you want when you get it. Fortunately, Tableau includes powerful tools to prepare and transform your data for analysis. With Tableau, you’ll create robust data transformations that take your data from raw, to ready for analysis. 

How to get started

3. Tell your data's story with interactive dashboards

Tell your data's story with interactive dashboards gif

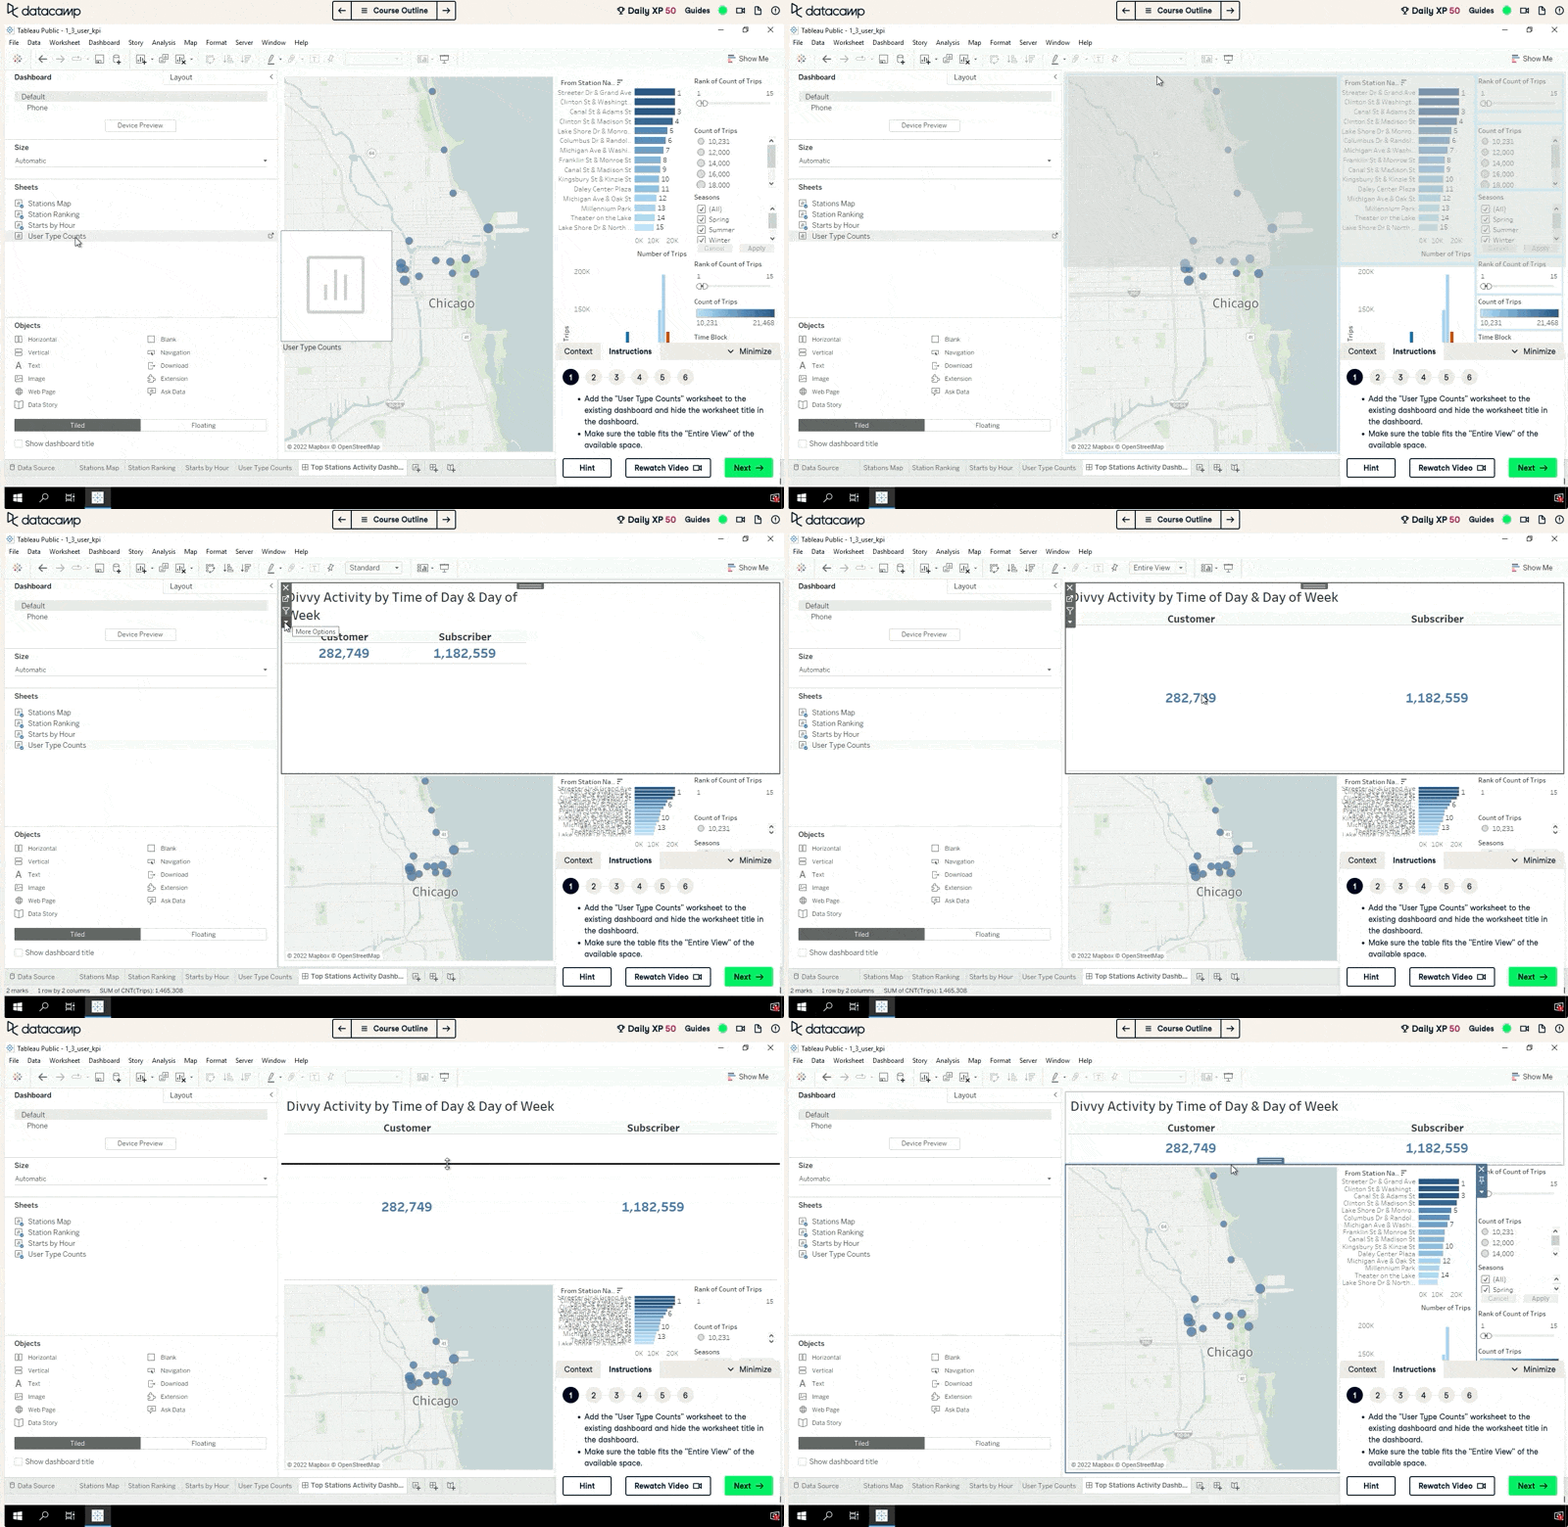
At its heart, Tableau is all about creating interactive dashboards to help you understand your data. DataCamp’s Tableau curriculum is designed to get you from zero to insights as fast as possible. 

How to get started

Topics

Tableau Courses

Course

Introduction to Tableau

6 hr
213.9K
Start your Tableau journey with our Introduction to Tableau course. Discover Tableau basics such as its features and dashboards.
See DetailsRight Arrow
Start Course
See MoreRight Arrow
Related

[Radar Recap] Building a Learning Culture for Analytics Functions, with Russell Johnson, Denisse Groenendaal-Lopez and Mark Stern

In the session, Russell Johnson, Chief Data Scientist at Marks & Spencer, Denisse Groenendaal-Lopez, Learning & Development Business Partner at Booking Group, and Mark Stern, VP of Business Intelligence & Analytics at BetMGM will address the importance of fostering a learning environment for driving success with analytics.
Adel Nehme's photo

Adel Nehme

41 min

[Radar Recap] From Data Governance to Data Discoverability: Building Trust in Data Within Your Organization with Esther Munyi, Amy Grace, Stefaan Verhulst and Malarvizhi Veerappan

Esther Munyi, Amy Grace, Stefaan Verhulst and Malarvizhi Veerappan focus on strategies for improving data quality, fostering a culture of trust around data, and balancing robust governance with the need for accessible, high-quality data.
Richie Cotton's photo

Richie Cotton

39 min

[Radar Recap] Scaling Data ROI: Driving Analytics Adoption Within Your Organization with Laura Gent Felker, Omar Khawaja and Tiffany Perkins-Munn

Laura, Omar and Tiffany explore best practices when it comes to scaling analytics adoption within the wider organization
Richie Cotton's photo

Richie Cotton

40 min

Tableau Prep Builder: A Comprehensive Guide to Data Preparation

Learn all about Tableau Prep Builder and its functions in preparing and loading data into Tableau.
Austin Chia's photo

Austin Chia

11 min

Tableau Parameters: An Introductory Guide and How to Use Them

Learn all about parameters in Tableau and how to use them.
Austin Chia's photo

Austin Chia

LOD Expressions in Tableau: A Tutorial With Examples

Learn more about LOD expressions in Tableau and how to use them.
Austin Chia's photo

Austin Chia

See MoreSee More