HomeCheat sheetsR Programming

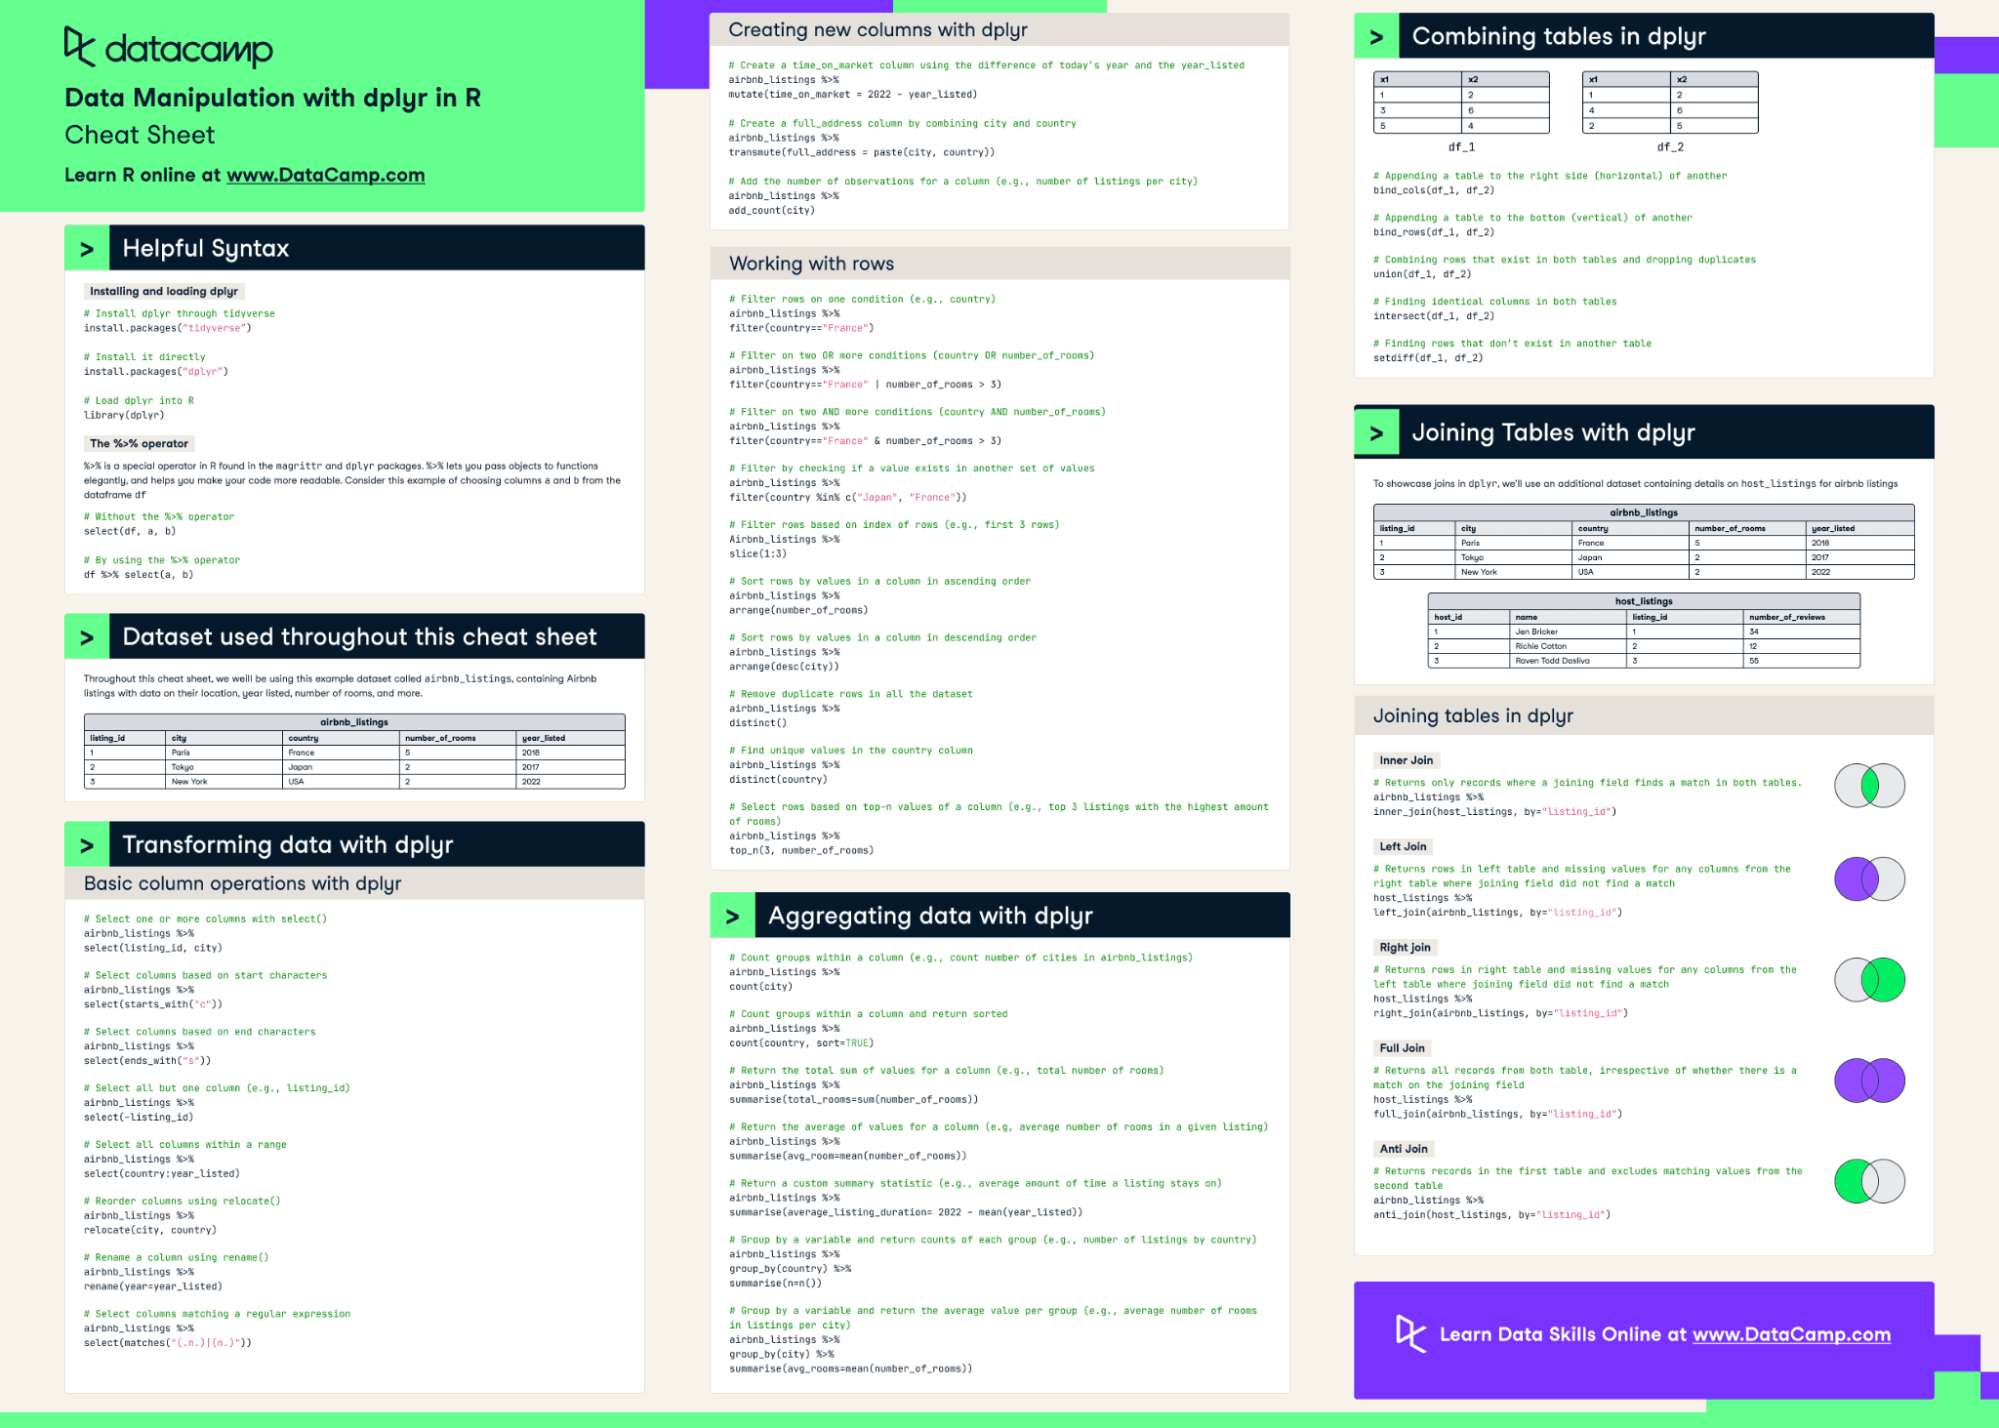
Data Manipulation with dplyr in R Cheat Sheet

With this data manipulation with dplyr in the R cheat sheet, you'll have a handy reference guide in your R upskilling journey.
Aug 2022  · 7 min read

Dplyr is one of the most widely used tools in data analysis in R. Part of the tidyverse, it provides practitioners with a host of tools and functions to manipulate data, transform columns and rows, calculate aggregations, and join different datasets together. 

In this cheat sheet, you'll find a handy list of functions covering dplyr functions —all collected from our Data Manipulation with dplyr course.

Data Manipulation with Dplyr Cheat Sheet

Have this cheat sheet at your fingertips

Download PDF

Helpful syntax to know 

Installing and loading dplyr

# Install dplyr through tidyverse 
install.packages(“tidyverse”)

# Install it directly
install.packages(“dplyr”)

# Load dplyr into R
library(dplyr)

The %>% operator

%>% is a special operator in R found in the magrittr and dplyr packages. %>% lets you pass objects to functions elegantly, and helps you make your code more readable. Consider this example of choosing columns a and b from the dataframe df

# Without the %>% operator
select(df, a, b)

# By using the %>% operator
df %>% select(a, b)

Dataset used throughout this cheat sheet

Throughout this cheat sheet, we will be using this example dataset called airbnb_listings, containing Airbnb listings with data on their location, year listed, number of rooms, and more.

airbnb_listings
listing_id city country number_of_rooms year_listed
1 Paris France 5 2018
2 Tokyo Japan 2 2017
3 New York USA 2 2022

Transforming data with dplyr

Basic column operations with dplyr

# Select one or more columns with select() 
airbnb_listings %>% 
select(listing_id, city)

# Select columns based on start characters 
airbnb_listings %>% 
select(starts_with(“c”))

# Select columns based on end characters 
airbnb_listings %>% 
select(ends_with(“s”))

# Select all but one column (e.g., listing_id) 
airbnb_listings %>% 
select(-listing_id)

# Select all columns within a range 
airbnb_listings %>% 
select(country : year_listed)

# Reorder columns using relocate() 
airbnb_listings %>% 
relocate(city, country)

# Rename a column using rename() 
airbnb_listings %>% 
rename(year = year_listed)

# Select columns matching a regular expression 
airbnb_listings %>% 
select(matches(“(.n.) | (n.)”))

Creating new columns with dplyr

# Create a time_on_market column using the difference of today’s year and the year_listed 
airbnb_listings %>% 
mutate(time_on_market = 2022 - year_listed)

# Create a full_address column by combining city and country 
airbnb_listings %>% 
transmute(full_address = paste(city, country))

# Add the number of observations for a column (e.g., number of listings per city) 
airbnb_listings %>% 
add_count(city)

Working with rows

# Filter rows on one condition (e.g., country) 
airbnb_listings %>% 
filter(country == "France")

# Filter on two OR more conditions (country OR number_of_rooms) 
airbnb_listings %>% 
filter(country == "France" | number_of_rooms > 3)

# Filter on two AND more conditions (country AND number_of_rooms) 
airbnb_listings %>% 
filter(country == "France" & number_of_rooms > 3)

# Filter by checking if a value exists in another set of values 
airbnb_listings %>% 
filter(country %in% c( "Japan", "France"))

# Filter rows based on index of rows (e.g., first 3 rows) 
Airbnb_listings %>% 
slice(1:3)

# Sort rows by values in a column in ascending order 
airbnb_listings %>% 
arrange(number_of_rooms)

# Sort rows by values in a column in descending order 
airbnb_listings %>% 
arrange(desc(city))

# Remove duplicate rows in all the dataset 
airbnb_listings %>% 
distinct()

# Find unique values in the country column 
airbnb_listings %>% 
distinct(country)

# Select rows based on top-n values of a column (e.g., top 3 listings with the highest amount of rooms)
airbnb_listings %>% 
top_n(3, number_of_rooms)

Aggregating data with dplyr

# Count groups within a column (e.g., count number of cities in airbnb_listings) 
airbnb_listings %>% 
count(city)

# Count groups within a column and return sorted 
airbnb_listings %>% 
count(country, sort = TRUE)

# Return the total sum of values for a column (e.g., total number of rooms) 
airbnb_listings %>% 
summarise(total_rooms=sum(number_of_rooms))

# Return the average of values for a column (e.g, average number of rooms in a given listing)
airbnb_listings %>% 
summarise(avg_room = mean(number_of_rooms))

# Return a custom summary statistic (e.g., average amount of time a listing stays on) 
airbnb_listings %>% 
summarise(average_listing_duration = 2022 - mean(year_listed))

# Group by a variable and return counts of each group (e.g., number of listings by country) 
airbnb_listings %>% 
group_by(country) %>% 
summarise(n = n())

# Group by a variable and return the average value per group (e.g., average number of rooms in listings per city) 
airbnb_listings %>% 
group_by(city) %>% 
summarise(avg_rooms = mean(number_of_rooms))

Combining tables in dplyr

df_1

x1 x2
1 2
3 6
5 4

df_2

x1 x2
1 2
4 6
2 5
# Appending a table to the right side (horizontal) of another 
bind_cols(df_1, df_2)

# Appending a table to the bottom (vertical) of another 
bind_rows(df_1, df_2)

# Combining rows that exist in both tables and dropping duplicates 
union(df_1, df_2)

# Finding identical columns in both tables 
intersect(df_1, df_2)

# Finding rows that don’t exist in another table 
setdiff(df_1, df_2)

Joining tables with dplyr

To showcase joins in dplyr, we’ll use an additional dataset containing details on *host_listings* for airbnb listings

airbnb_listings
listing_id city country number_of_rooms year_listed
1 Paris France 5 2018
2 Tokyo Japan 2 2017
3 New York USA 2 2022
host_listings
host_id name listing_id number_of_reviews
1 Jen Bricker 1 34
2 Richie Cotton 2 12
3 Raven Todd Dasilva 3 55

Joining tables with dplyr

Inner Join

# Returns only records where a joining field finds a match in both tables. 
airbnb_listings %>% 
inner_join(host_listings, by = "listing_id")

Left Join

# Returns rows in left table and missing values for any columns from the right table where joining field did not find a match 
host_listings %>% 
left_join(airbnb_listings, by = "listing_id")

Right Join

# Returns rows in right table and missing values for any columns from the left table where joining field did not find a match 
host_listings %>% 
right_join(airbnb_listings, by = "listing_id")

Full Join

# Returns all records from both table, irrespective of whether there is a match on the joining field
host_listings %>% 
full_join(airbnb_listings, by = "listing_id")

Anti Join

# Returns records in the first table and excludes matching values from the second table 
airbnb_listings %>% 
anti_join(host_listings, by = "listing_id")
Topics
Related

Data Science in Finance: Unlocking New Potentials in Financial Markets

Discover the role of data science in finance, shaping tomorrow's financial strategies. Gain insights into advanced analytics and investment trends.
 Shawn Plummer's photo

Shawn Plummer

9 min

5 Common Data Science Challenges and Effective Solutions

Emerging technologies are changing the data science world, bringing new data science challenges to businesses. Here are 5 data science challenges and solutions.
DataCamp Team's photo

DataCamp Team

8 min

Navigating R Certifications in 2024: A Comprehensive Guide

Explore DataCamp's R programming certifications with our guide. Learn about Data Scientist and Data Analyst paths, preparation tips, and career advancement.
Matt Crabtree's photo

Matt Crabtree

8 min

A Data Science Roadmap for 2024

Do you want to start or grow in the field of data science? This data science roadmap helps you understand and get started in the data science landscape.
Mark Graus's photo

Mark Graus

10 min

Introduction to DynamoDB: Mastering NoSQL Database with Node.js | A Beginner's Tutorial

Learn to master DynamoDB with Node.js in this beginner's guide. Explore table creation, CRUD operations, and scalability in AWS's NoSQL database.
Gary Alway's photo

Gary Alway

11 min

How to Transpose a Matrix in R: A Quick Tutorial

Learn three methods to transpose a matrix in R in this quick tutorial
Adel Nehme's photo

Adel Nehme

See MoreSee More