Tidyverse Cheat Sheet For Beginners
The tidyverse is a powerful collection of R packages that you can use for data science. They are designed to help you to transform and visualize data. All packages within this collection share an underlying philosophy and common APIs.
As you might know, DataCamp recently launched the Introduction to the Tidyverse course together with David Robinson, Data Scientist at Stack Overflow.
Now, DataCamp has created a tidyverse cheat sheet for beginners that have already taken the course and that still want a handy one-page reference or for those who need an extra push to get started on discovering this popular collection of packages. You must have already run into packages such as ggplot2 and dplyr, so this cheat sheet will definitely come in handy!
It's a quick guide through the basics of manipulating and visualizing your data the powerful tools that the tidyverse has to offer in R!
Have this cheat sheet at your fingertips
Download PDFThe tidyverse cheat sheet will guide you through some general information on the tidyverse, and then covers topics such as useful functions, loading in your data, manipulating it with dplyr and lastly, visualize it with ggplot2.
In short, everything that you need to kickstart your data science learning with R!
Do you want to learn more? Also check out and star the Exploratory Data Analysis in R: Case Study course, also taught by David Robinson, for free now!
Also, don't miss out on our data.table cheat sheet for data manipulation in R and our other cheat sheets for data science.
What is Tidyverse?
The tidyverse is a powerful collection of R packages that are actually data tools for transforming and visualizing data. All packages of the tidyverse share an underlying philosophy and common APls.
The core packages are:
- ggplot2, which implements the grammar of graphics. You can use it to visualize your data.
- dplyr is a grammar of data You can use it to solve the most common data manipulation challenges.
- tidyr helps you to create tidy data or data where each variable is in a column, each observation is a row end each value is a column, each observation is a row end each value is a cell.
- readr is a fast and friendly way to read rectangular
- purrr enhances R"s functional programming (FP)toolkit by providing a complete and consistent set of tools for working with functions and vectors.
- tibble is a modern re-imaginging of the data
- stringr provides a cohesive set of functions designed to make working with strings as easy as possible
- forcats provide a suite of useful tools that solve common problems with factors.
You can install the complete tidyverse with:
> install.packages("tidyverse")
Then, load the core tidyverse and make it available in your current R session by running:
> library(tidyverse)
Note: there are many other tidyverse packages with more specialised usage. They are not loaded automatically with
library(tidyverse),so you'll need to load each one with its own call to library().
Useful Functions
> tidyverse_conflicts() #Conflicts between tidyverse and other packages
> tidyverse_deps() #List all tidyverse dependencies
> tidyverse_logo() #Get tidyverse logo, using ASCII or unicode characters
> tidyverse_packages() #List all tidyverse packages
> tidyverse_update() #Update tidyverse packages
Loading in the Data
>	library(datasets) #Load the datasets package
>	library(gapminder) #Load the gapminder package
>	attach(iris) #Attach iris data to the R search path
Dplyr
Filter
filter() allows you to select a subset of rows in a data frame.
>iris%>% #Select iris data of species "virginica"
          filter(Species=1"virginica")

>iris%>% #Select iris data of species "virginica" and sepal length greater than 6.
           filter(Species="virginica",
           Sepal.Length> 6)
Arrange
arrange() sorts the observations in a dataset in ascending or descending order based on one of its variables.
>iris%>% #Sort in ascending order of sepal length
          arrange(Sepal.Length)
>iris%>% #Sort in descending order of sepal length
          arrange(desc(Sepal.Length))
Combine multiple dplyr verbs in a row with the pipe operator %>%:
>iris%>% #Filter for species "virginica" then arrange in descending order of sepal length
          filter(Species="virginica") %>%
          arrange(desc(Sepal.Length))
Mutate
mutate() allows you to update or create new columns of a data frame.
>iris%>% #Change Sepal.Length to be in millimeters
     mutate(Sepal.Length=Sepal.Length*10)
>iris%>% #Create a new column called SLMm
     mutate(SLMm=Sepal.Length*10)
Combine the verbs filter(), arrange(), and mutate():
>iris%>%
     filter(Species="Virginica") %>%
     mutate(SLMm=Sepal.Length*10) %>%
     arrange(desc(SLMm))
Summarize
summarize() allows you to turn many observations into a single data point.
>iris%>% #Summarize to find the median sepal length
     summarize(medianSL=median(Sepal.Length))

>iris%>% #Filter for virginica then summarize the median sepal Length
     filter(Species="virginica") %>%
     summarize(medianSL=median(Sepal.Length))
You can also summarize multiple variables at once:
>iris%>%
     filter(Species="virginica") %>%
     summarize(medianSL=median(Sepal.Length),
          maxSL=max(Sepal.Length))
group_by () allows you to summarize within groups instead of summarizing the entire dataset:
>iris%>% #Find median and max sepal length of each species
     group_by(Species) %>%
     summarize(medianSL=median(Sepal.Length),
     maxSL=max(Sepal.Length))

>iris%>% #Find median and max petal length of each species with sepal length> 6
     filter(Sepal.Length>6) %>%
     group_by(Species) %>%
     summarize(medianPL=median(Petal.Length),
     maxPL=max(Petal.Length))
ggplot2
Scatter Plot
Scatter plots allow you to compare two variables within your data. To do this with ggplot2, you use geom_point()
>iris_small f- iris%>%
     filter(Sepal.Length > 5)

>ggplot(iris_small, aes(x=Petal.Length, #Compare petal width and length
     y=Petal.Width)) + geom_point()
Additional Aesthetics
Color
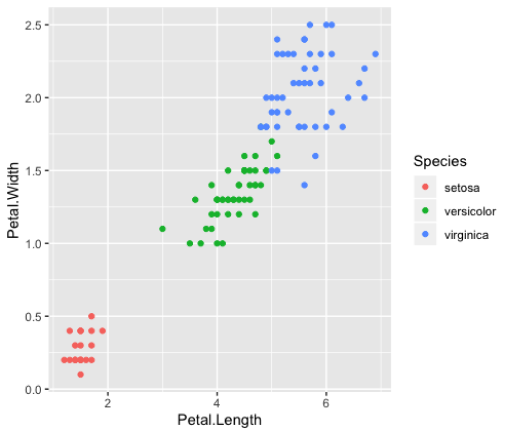
>ggplot(iris_small, aes(x=Petal.Length,
     y=Petal.Width,
     calar=Species)) +
  geom_point()
Size
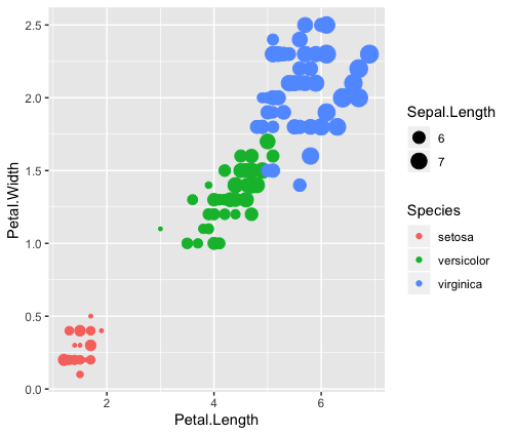
>ggplot(iris_small, aes(x=Petal.Length,
          y=Petal.Width,
          color=Species,
          size=Sepal.Length)) +
     geom_point()
Faceting
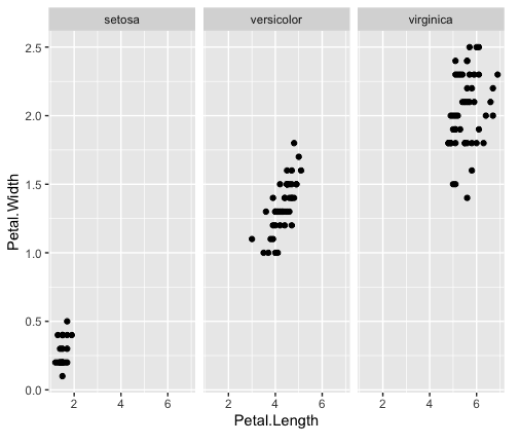
>ggplot(iris_small, aes(x=Petal.Length,
          y=Petal.Width)) +
     geom_point()+
     facet_wrap(NSpecies)
Line Plots
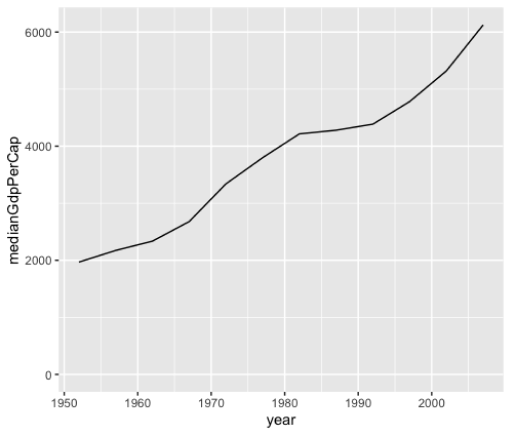
>	by_year <-- gapminder %>%
          group_by(year) %>%
          summarize(medianGdpPerCap=median(gdpPercap))
>	ggplot(by_year, aes(x=year,
          y=medianGdpPerCap))+
     geom_line()+
     expand_limits(y=0)
Bar Plots
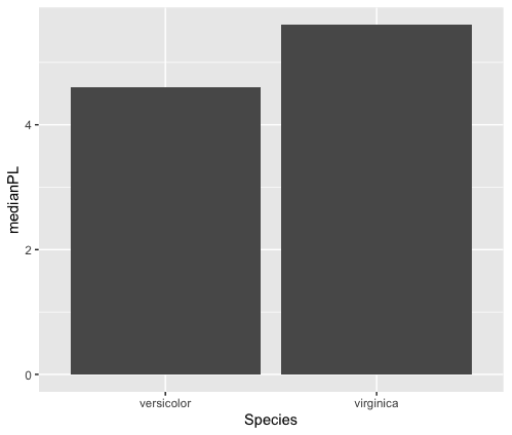
> by_species <--iris%>%
     filter(Sepal.Length>6) %>%
     group_by(Species) %>%
     summarize(medianPL=median(Petal.Length))
> ggplot(by_species, aes(x=Species,
          y=medianPL)) +
     geom_col()
Histograms
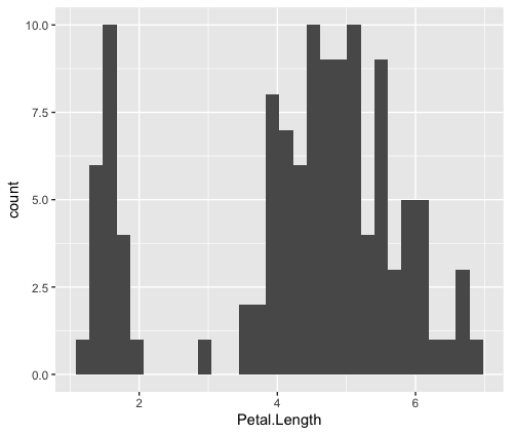
> ggplot(iris_small, aes(x=Petal.Length))+
     geom_histogram()
Box Plots
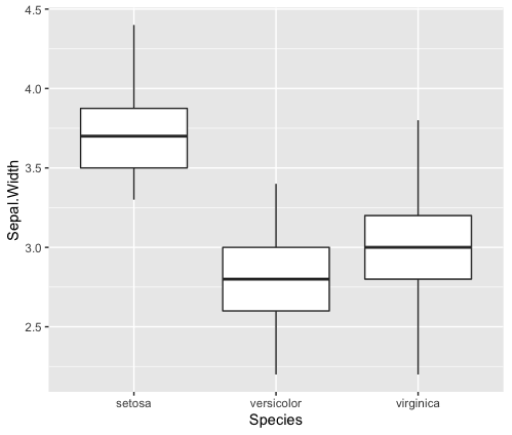
> ggplot(iris_small, aes(x=Species,
          y=Sepal.Width))+
     geom_boxplot()
(Click above to download a printable version or read the online version below).
Learn more about Tidyverse
Here are a few extra Tidyverse resources to get you started:
Working with Data in the Tidyverse


5 Common Data Science Challenges and Effective Solutions
DataCamp Team
8 min

Navigating R Certifications in 2024: A Comprehensive Guide

Matt Crabtree
8 min
A Data Science Roadmap for 2024

Mark Graus
10 min

Data Storytelling and Visualization with Lea Pica from Present Beyond Measure

Richie Cotton
71 min
Introduction to DynamoDB: Mastering NoSQL Database with Node.js | A Beginner's Tutorial

Gary Alway
11 min
How to Transpose a Matrix in R: A Quick Tutorial

Adel Nehme