HomeBlogPower BI

How to Export Power BI Data to Excel

Wish you could see the data behind your Power BI visualizations? Here’s our guide to exporting Power BI data to Excel.
Aug 2022  · 6 min read

Power BI is one of the most widely used business intelligence tools today. Developed by Microsoft, Power BI lets you manage, analyze, and visualize huge amounts of data with no coding involved. Another key advantage of using Power BI is the ability for Excel experts to switch from Power BI to Excel and vice-versa.

What are the different ways Power BI and Excel work with each other? In this tutorial, we'll explore common use cases of exporting Power BI data & reports into Excel. Let’s get started!

Training 2 or more people? Check out our Business solutions

Get your team access to the full DataCamp library, with centralized reporting, assignments, projects and more

Try DataCamp for Business
homepage-hero.png

Common Use Cases of Exporting Power BI Data and Reports into Excel

There are a few reasons for which you would need to export data and reports from Power BI to Excel:

  • Analyzing the data in Excel: Even if Power BI has superior capabilities to Excel to store and process data, Excel can still be useful to create reports and dashboards using Power BI’s Analyze in Excel feature. Moreover, it may be more intuitive for Excel experts to learn Power BI gradually without abandoning Excel completely.
  • Data Exports: A colleague is interested in having the data behind the report, but they don’t have Power BI installed. Exporting the underlying data to Excel is an easy solution. 
  • Cross-tool use: If you are working in a team with various types of data practitioners. Certain team members may use other tools such as R or Python. Exporting Power BI data and reports to Excel will allow them to do just that. 

Exporting Data from a Power BI Dashboard

Exporting Data from a Power BI Dashboard

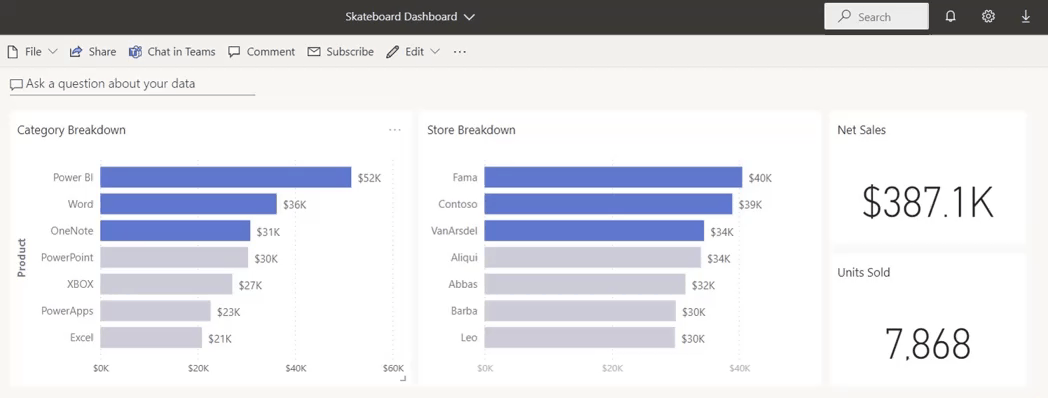
Power BI Dashboards allow you to place visualizations, reports, and tables, all in one place for an at-a-glance view. However, oftentimes, you may want to investigate the underlying data behind the visualizations in your dashboard or send it to a colleague. Here are the steps to export data from a Power BI Dashboard:

  • Go to your Power BI instance and log in with your account’s credentials. If you don’t have an account, you will need to create one. 
  • Go to the Power BI dashboard in question and choose the data visualization from which you are interested in exporting the data.
  • Click More options (…) from the upper right corner of the chosen data visualization.
  • Select the option Export to .csv.
  • You can then open up this .csv file in Excel. 

Exporting Data from a Power BI Report

Exporting Data from a Power BI Report

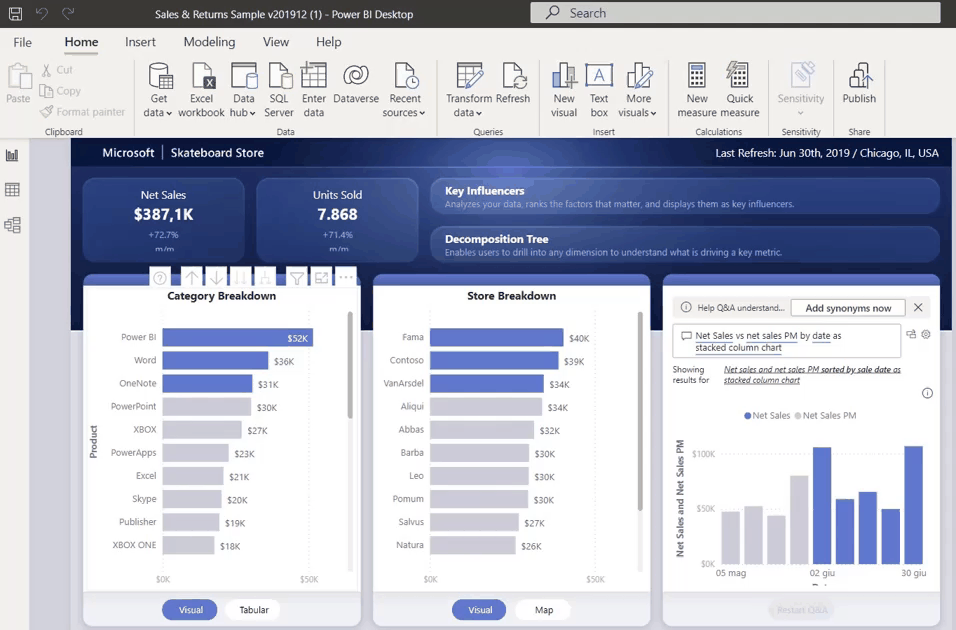
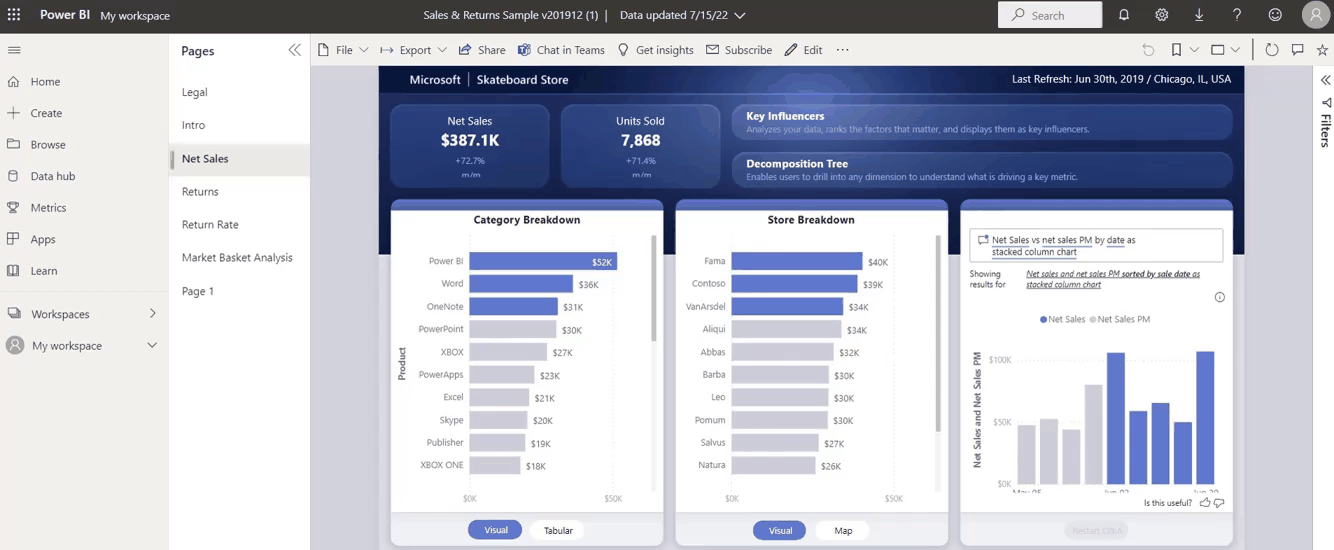
Power BI Reports are often confused with Dashboards since they both contain data visualizations and tables. Reports can have more than one page and permit viewers to find different ways to filter, highlight, and slice the data. Moreover, they are a great option for creating comprehensive summaries of your to share with the stakeholders. 

There are the following steps to export data from Power BI Reports:

  • Access the report from Power BI Desktop. If you don’t have Power BI Desktop installed, go here
  • Choose the data visualization from which you are interested in exporting the data.
  • Click the tile settings of the chosen data visualization 
  • Select the option “Export data”.

Copying Power BI Tables into Excel

Copying Power BI Tables into Excel

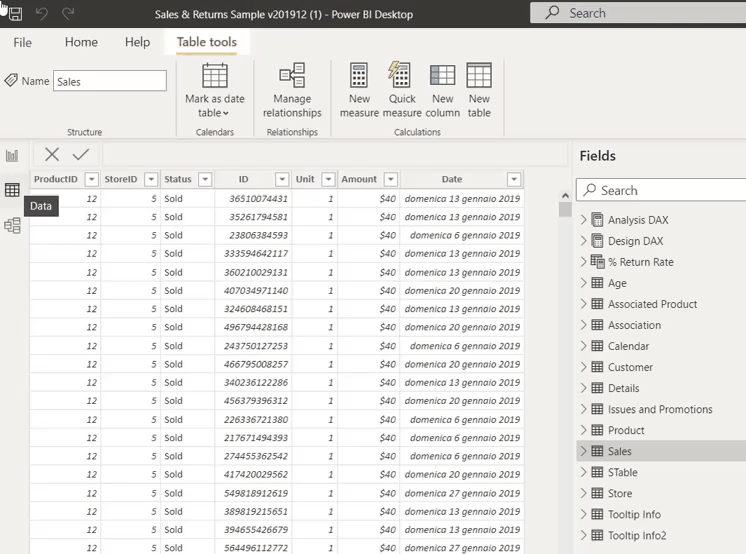
The steps to copy a Power BI Table to Excel are very simple and intuitive:

  • Go to Power BI Desktop.
  • Choose the Power BI table you want and go to the data view option on the left side panel.
  • Right-click on the chosen table; in this case, it’s called “Sales.”
  • Select the option “Copy Table.” 
  • Create a new sheet in Excel and paste the content of the table by clicking the Paste icon or Ctrl + V

Exporting from Power BI into Excel with the “Analyze in Excel” Feature

In Power BI Service, there is an additional feature to bring a Power BI dataset into Excel. This can be useful to process the data into Excel and then use the processed data in Excel to generate data visualizations. These are three different ways to utilize the “Analyze in Excel” function of Power BI.

1. Analyze in Excel feature from My Workspace

Analyze in Excel feature from My Workspace

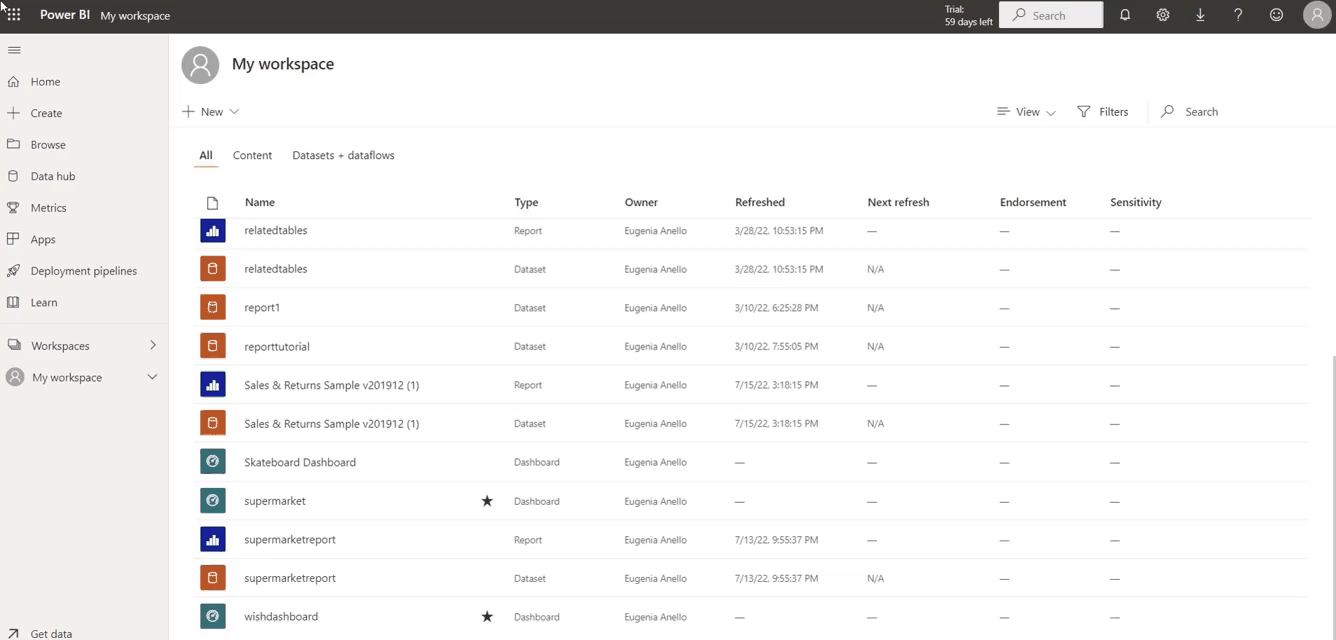
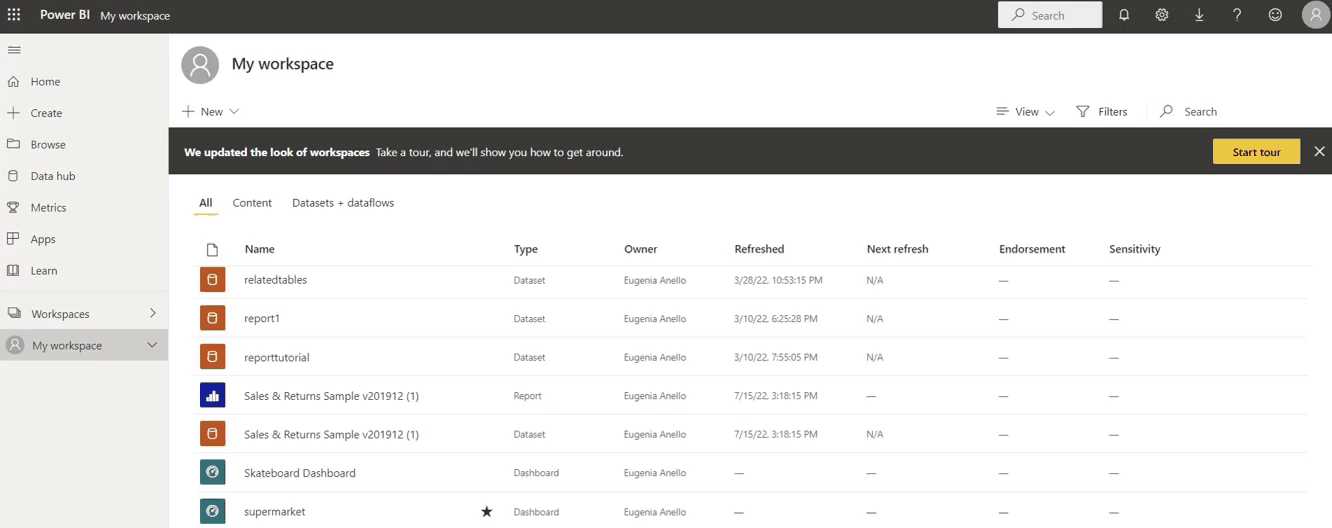
My Workspace in Power BI is a view that contains a collection of datasets, reports, and dashboards you’ve created in the past. You can use the Analyze in Excel feature to export any of these datasets and reports into Excel. Here’s how:

  1. Go to app.powerbi.com, where the collection of all your works will appear on your Power BI account.
  2. Select Download from the menu. If you haven’t done this already, click Analyze in Excel updates. This operation is mandatory, otherwise, the Analyze in Excel feature won’t work. 
  3. Once you’re ready, choose the Power BI dataset you want to analyze in Excel.
  4. Select More options (…) next to the dataset and then click “Analyze in Excel”.
  5. When you open the new excel file, enable the editing and content. You shouldn’t have problems if you have installed the Analyze in Excel updates. But in case you still have issues, check this article for further guidance.

2. Analyze in Excel feature from the view of the dataset

Analyze in Excel feature from the view of the dataset

An alternative method is to click the name of the dataset in your workplace.  A new page will be opened where you can select “Analyze in Excel” in the menu bar above the page.

3. Analyze in Excel feature from the report

Analyze in Excel feature from the report

The third and last way is to open a Power BI report and select Export → Analyze in Excel in the menu bar.

More Power BI Resources

We hope you found this tutorial useful. This article discussed different ways to export Power BI data to Excel. This functionality can be very useful when you want to store and analyze the data outside Power BI. You can do a deeper dive into Power BI with DataCamp’s resources.

Topics

Power BI courses

Course

Introduction to Power BI

3 hr
348.9K
Master the Power BI basics and learn to use the data visualization software to build impactful reports.
See DetailsRight Arrow
Start Course
See MoreRight Arrow
Related

blog

Power BI Developer Salaries in 2024: Unlock Your Earning Potential

Learn all about Power BI Developer Salaries, what to expect in the role, and how to increase your compensation
Joleen Bothma's photo

Joleen Bothma

6 min

tutorial

How to Use the XLOOKUP Excel Function with Multiple Criteria

This tutorial discusses the purpose and syntax of the XLOOKUP Excel function, its advantages concerning its predecessors, the two main ways of using XLOOKUP with multiple criteria including their pros and cons, extending functionality through the optional parameters, and the way of running a similar search in older Excel versions.
Elena Kosourova's photo

Elena Kosourova

0 min

tutorial

How to Calculate Confidence Intervals in Excel

A beginner-friendly, comprehensive tutorial on understanding Confidence Interval calculations in Microsoft Excel.
Arunn Thevapalan's photo

Arunn Thevapalan

8 min

tutorial

A Comprehensive Guide to DAX LOOKUPVALUE

Master the LOOKUPVALUE function in Power BI with simple examples and advanced combinations with other DAX functions.
Joleen Bothma's photo

Joleen Bothma

9 min

tutorial

Monte Carlo Simulation in Excel: A Complete Guide

A beginner-friendly, comprehensive tutorial on performing Monte Carlo Simulation in Microsoft Excel, along with examples, best practices, and advanced techniques.
Arunn Thevapalan's photo

Arunn Thevapalan

9 min

tutorial

Power BI Matrix: A Comprehensive Guide

Enhance your data analysis skills by learning how to customize a Power BI matrix.
Joleen Bothma's photo

Joleen Bothma

10 min

See MoreSee More