course
Introduction to R
4 hours
2.7M

Crafting an impressive resume alone is not sufficient to break into the data science job market. If you want to start a career in data science, it’s a crucial step to build a data portfolio of relevant projects that would showcase your data skills in the interview.
The good news is that it's never too early or too late to start creating such a portfolio. Whether you're a total newbie or already halfway through learning data science, you can begin working on your R projects now.
It's perfectly fine for your first projects to look amateur. You can always return to them later, elaborate on them, refine them, or even delete them when you make more advanced projects. The most important thing here is to start the process.
In this article, we'll outline some helpful ideas for your data science projects using R and look at some examples to get you started. We'll also discuss the R programming language and how it's used for data analysis and data science.
R is a programming language used for data analysis, data science, and machine learning, and it also includes an environment for statistical computing and graphics. R is specifically designed for advanced and fast statistical computing, data modeling, and building impactful visualizations. This is where this language demonstrates its real power.
In addition, R:
You'll find more information about the R programming language and how to learn it with our What is R? - The Statistical Computing Powerhouse and How to Get Started with R articles. You can also take a DataCamp course Introduction to R.
To start learning R from zero or to master particular technical skills, check out our various learning resources, including courses, skill tracks, and career tracks. In particular, for a well-balanced and comprehensive path to learning R, consider the career tracks Data Scientist with R and Machine Learning Scientist with R.
Performing data analysis is the first step of any data science project. It's logical: before diving into predicting future scenarios using machine learning and deep learning techniques, we have to reveal the current (and past) state of things.
On the other hand, data analysis can be a stand-alone task. In both cases, R provides us with a wide spectrum of useful libraries specifically adapted for analytical purposes.
With R, we can parse the data from websites, clean and wrangle it, visualize it, explore its statistics, make and test hypotheses, and extract meaningful insights and patterns from the initial data. Among these tasks, statistical analysis and amazing visualizations are a real winning card of R, and this is where this programming language usually beats its main rival, Python.
Apart from common multipurpose packages of R, there are a lot of modules designed for various applied analytical problems. For example:
fAssets: This package is designed to analyze and model financial assets.
mdapack: This is a medical data analysis package.
GEOmap: This package is used for topographic and geologic mapping.
AeRobiology: This computational tool is for aerobiological data.
galigor: This is a collection of packages for Internet marketing.
lingtypology: This package is used for linguistic typology and mapping.
Additionally, R includes even such hyper-focused libraries as:
As we mentioned earlier, R is a data science-oriented programming language that offers more than 19,000 data science packages. In addition to purely analytical tasks listed in the previous section, we can use R for more advanced problems with the scope to forecast and model unknown data. Using R allows us to:
Again, along with commonly used data science packages (caret for classification and regression training, naivebayes for implementing the Naive Bayes algorithm, randomForest for building random forest models, deepNN for deep learning, etc.), there are many highly-specialized libraries, up to really specific ones. To mention some of them:
OenoKPM: This package is used to model the kinetics of CO2 production in alcoholic fermentation.
fHMM: This package is designed to fit hidden Markov models into financial data.
paleopop: This is a pattern-oriented modeling framework for coupled niche-population paleo-climatic models.
ibdsim2: This package is used to simulate chromosomal regions shared by family members.
rSHAPE: This package is designed to simulate the haploid asexual population evolution.
Now, we're going to take a look at some examples of R projects and spot interesting ideas for further development, both for beginners and experienced users.
One of the most worthwhile ways to look for R projects is to create such examples by yourself!
No worries, it isn't as scary as it looks. Even if you're a beginner in data science in R, you can opt for "sandbox" projects that come with the data ready to be analyzed or modeled, introduce you to the context of a problem, and provide helpful guidance on what steps to do and why.
If you're a more advanced learner, you're always welcome to explore the data deeper, from different angles, and go much beyond the suggested instructions to satisfy your curiosity about the data. In any case, active learning while doing is a better alternative to just reading other people's projects.
DataCamp offers a big choice of such data science projects in R that will let you practice many technical skills. Such examples include importing and cleaning data, data manipulation, data visualization, probability & statistics, machine learning, and more.
Apart from popular topics (such as Exploring the NYC Airbnb Market, Visualizing COVID-19, Clustering Heart Disease Patient Data, or Predict Taxi Fares with Random Forests) that are traditionally analyzed in various data science schools, here, you'll also find numerous fresh and curious ones. Feel free to explore them more in-depth:
After looking through the existing R projects or making some guided ones by yourself, you can decide to start creating your own projects from scratch. This is always a good idea, at whatever stage of learning R you are.
If you're making one of your first unguided projects, the first thing to think about is where to find the data to work on. Luckily, there are plenty of popular online repositories that offer huge collections of free and well-documented datasets, both real-world and synthetic ones. Some noteworthy examples of such resources are DataLab, Kaggle, UCI Machine Learning Repository, Google Dataset Search, Google Cloud Platform, FiveThirtyEight, and Quandl
Now that you have a big choice of data, what exactly can you do with it as a beginner in R? Since those are going to be your first data science projects in R, consider conducting basic data cleaning and manipulation, simple data exploration, and data visualization.
Spotify is one of the largest digital music, video, and media services where you can find millions of songs, videos, and podcasts from around the world.
You can take an already-ready dataset Spotify Music Data, which contains about 600 top songs over a period of time and explore its statistics from many sides. For example consider analyzing the following factors and questions, supplementing your findings with meaningful plots where necessary:
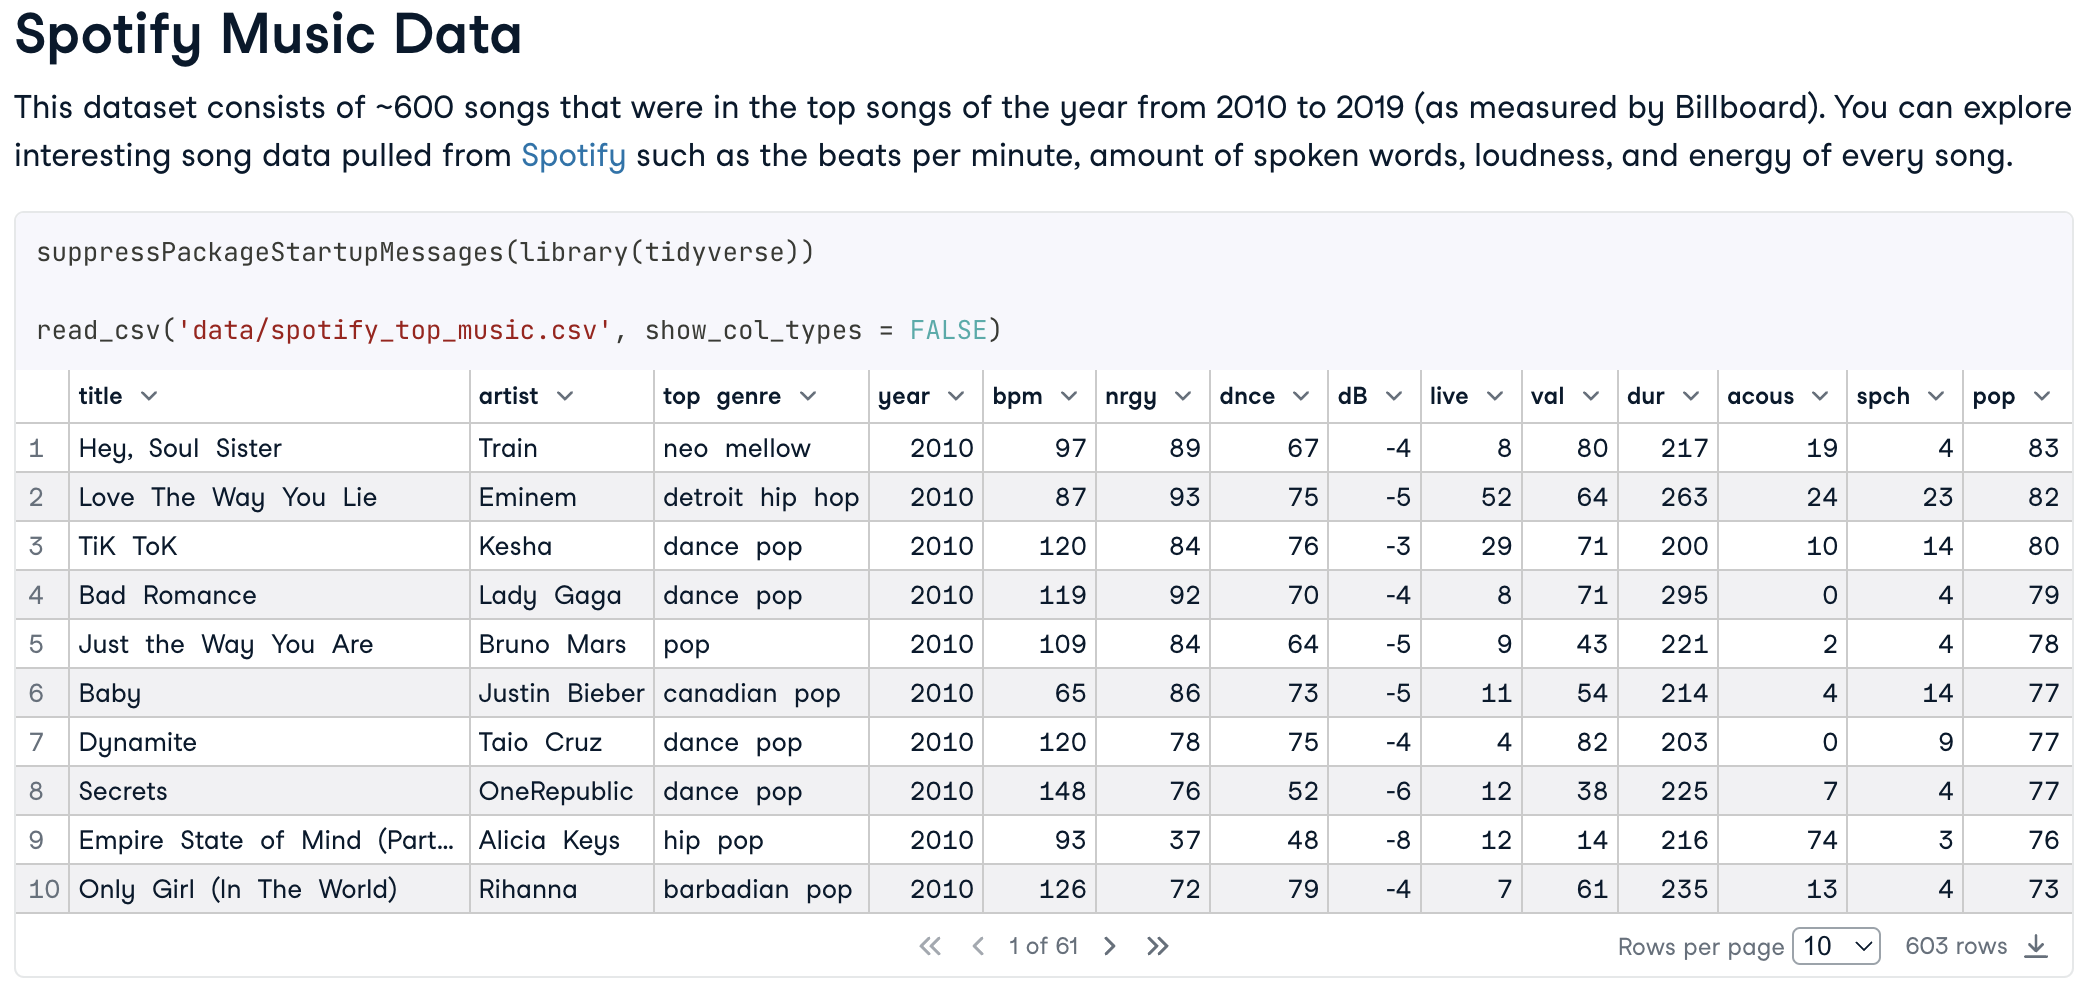
An example from the Spotify Music Data R Project
The National Basketball Association (NBA) is a North American men's professional basketball league of 30 teams, one of the largest in the world.
The NBA Shooting Data dataset contains the data gathered for four different players for the 2021 NBA play-offs. You can analyze and visualize this data and try to answer the following questions:
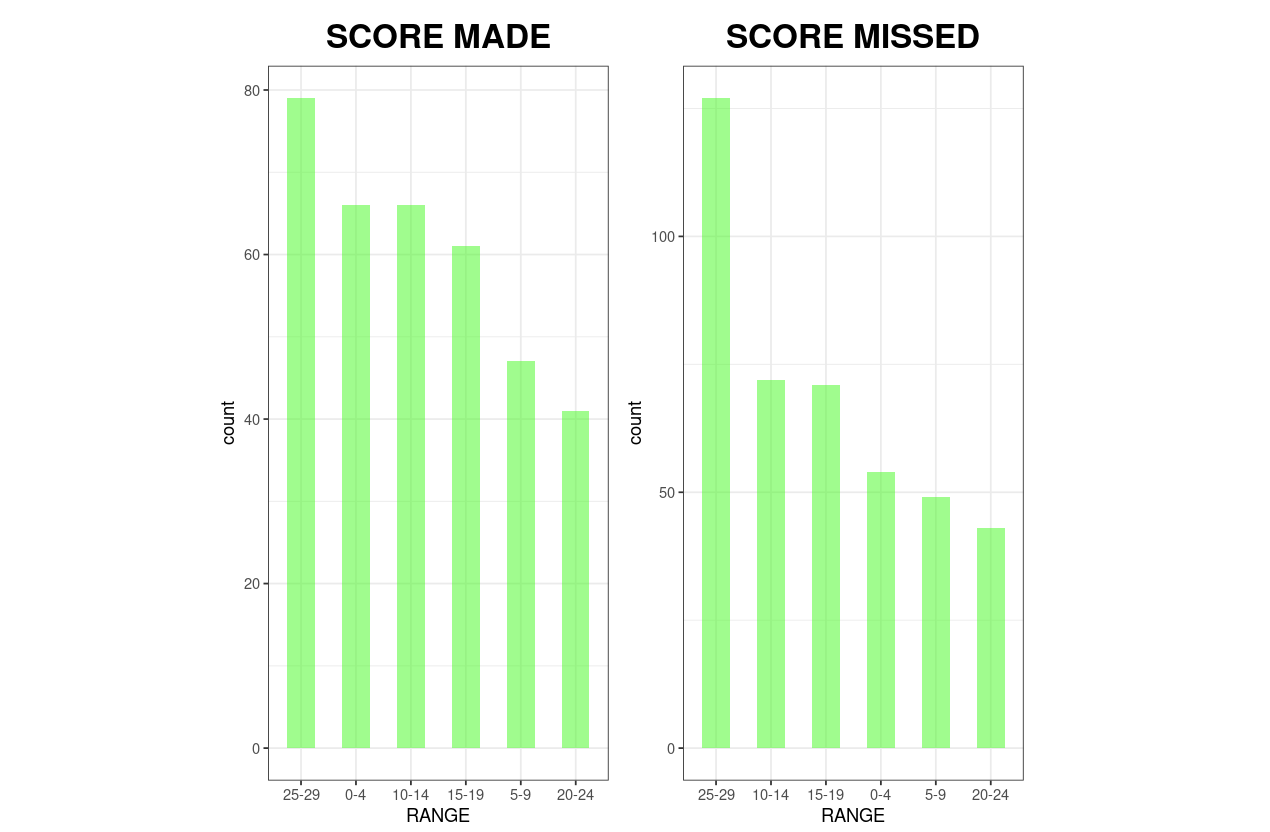
An example from the R project on NBA shooting statistics
Another interesting idea for a beginner data science R project is to investigate world population trends.
The World Population Data dataset provides total population statistics for each country from 1960 to 2020, as well as some additional information by country, such as its region, income group, and special notes (if any). There are multiple questions you can explore here:
Don't forget to add compelling plots wherever helpful: they'll aid your readers to better grasp the main insights from your analysis.
If you're mid-way in learning data science in R, you may be interested in building more sophisticated R projects where you would apply both your data analysis skills and some machine learning algorithms.
What topics can you select for them? Let's take a look at some potential ideas for your advanced data science R projects.
Customer churn is a tendency of customers to cancel their subscriptions to a service and, as a result, stop being a client of that service. It's calculated as the percentage of churned customers within a certain period.
This indicator depends on many factors and shows the overall business wellness of the company. When it's too high, the customer churn rate represents a grave problem for any company since it leads to the company's revenue loss and damages the company's reputation. Hence, it's very important to be able to predict customer churn rate to prevent it.
You can use the Telecom Customer Churn dataset to build a data science project on predicting customer churn rate in a telecom company.
In particular, here, you need to predict whether a customer will churn or not based on the available data and what factors increase the probability that a customer churns. Technically, this is a typical classification problem of machine learning when the clients are labeled as 1 (churn) or 0 (non-churn).
Credit card fraud is a serious challenge in banking since this sphere traditionally deals with a high number of online transactions. Credit card fraud detection is mostly a supervised classification problem where we can apply the methods like k-nearest neighbors (KNN), logistic regression, support vector machines (SVM), or decision tree.
However, it can also be solved using clustering, anomaly recognition, or artificial neural network approaches.
This problem is hard for the banking business in general because fraud patterns and fraudsters' tactics are constantly elaborating, so the fraud detection systems have to rapidly adapt to these changes.
For a data scientist or machine learning scientist, the challenge is also in the nature of such datasets: they always imply class imbalance, since fraud cases are always in a minority (fortunately) and are well-concealed among the real transactions (unfortunately).
The Credit Card Fraud dataset contains information about credit card transactions in the western United States. Consider using it for detecting credit card fraud by applying the classification approach.
As an additional prompt, the model should tend to be more conservative, meaning that for the sake of safety, it's not a big deal to label transactions as fraudulent when they aren't. You may also want to investigate a geospatial distribution of the fraud rates across different states.
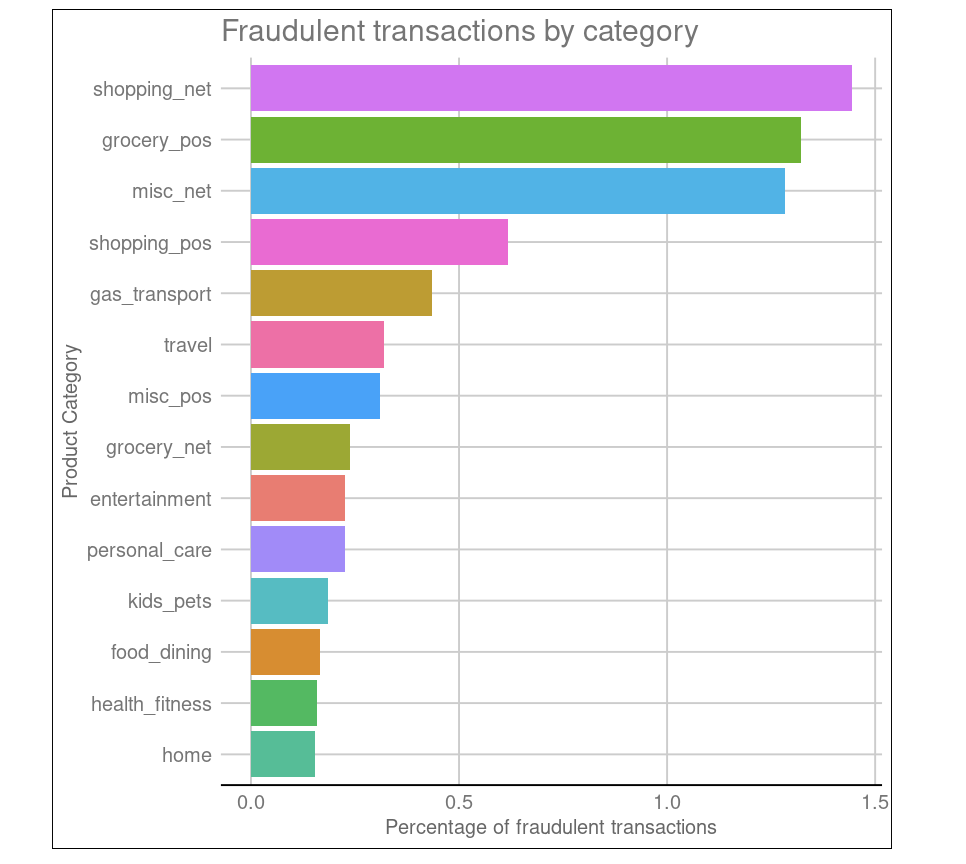
Another R project example from DataCamp
While the previous two projects were related to classifying data entries into predefined categories, here you're supposed to predict continuous outcomes based on input features. In other words, you need to solve a regression problem applying such methods as linear regression, ridge regression, lasso regression, decision tree, or support vector machines (SVM).
The Bike Sharing Demand dataset includes information about the number of public bikes rented in Seoul's bike-sharing system by hour, the weather, the date, the time, whether it was a public holiday or not, and more. Your task is to predict the number of bikes that will be rented based on that information.
You can also use this project to compare the average number of bikes rented by the time of day (morning, afternoon, and evening) across the four different seasons, explore the relationship between temperature and the number of bikes rented, etc. Where appropriate, add insightful visualizations to support your findings.
It's always a good idea to have in your portfolio at least one project that demonstrates your ability to apply unsupervised learning approaches.
For this purpose, consider the E-Commerce Data dataset that consists of purchases made in a UK-based online retailer by clients from different countries over a certain period of time.
A speculative scenario here is that the retailer wants to take inventory of the available items. As a presumable data scientist working in this company, you need to group the products into a small number of categories according to their similarity by some common characteristics (price, quantity sold, etc.). This is a clustering problem of unsupervised learning, with k-means as the most popular algorithm.
You can also analyze extra questions, such as what five countries are responsible for the most profit, or whether order sizes from countries outside the UK are significantly larger than orders from inside the UK.
Finally, consider flexing your natural language processing (NLP) skills in R in one of your projects.
The SMS Spam Collection dataset contains a collection of over 5,500 English messages labeled accordingly as spam or non-spam ("ham").
Based on this data, create a filter that will be able to distinguish between spam and regular messages accurately. To do so, you'll need to use an NLP package of R (for example, koRpus) to look for linguistic and contextual patterns in the text of the messages and figure out what makes a message spam or ham, for then to generalize these observations on the new data.
Optionally, you can investigate what the most common spam-prone words are by creating a word cloud visualization.
To wrap up, we discussed why it's important to build a portfolio of projects to start a career in data science, why and how to use R for data analysis and data science, where to find relevant data and examples of R projects, and what topics you can develop in those projects whether you're a beginner or an advanced data science learner.
Of course, the suggested ideas for your projects are only the tip of the iceberg. With R, you can do much more: create recommendation systems, perform customer segmentation, forecast stock exchange rates, conduct customer sentiment analysis, identify the optimal positioning of taxi cabs, and many other things.
Whether you're aiming to be a Data Scientist with R, a Data Analyst with R, a Machine Learning Scientist with R, or a Statistician with R, showcasing your skills through practical projects is invaluable. R's extensive library and community support make it an ideal choice for data analysis, machine learning, and advanced statistical computing.
By starting with simple projects and progressively tackling more complex challenges, you can build a portfolio that not only demonstrates your technical prowess but also your ability to derive meaningful insights from data. This hands-on experience will not only impress potential employers but also prepare you for the diverse and dynamic challenges you will face in your data science career.
For more inspiration, visit DataLab, an online IDE with preloaded datasets and predefined templates for writing code and analyzing data that helps you go from learning to doing data science.
Courses for R
course
course
course
blog
DataCamp Team
4 min
blog
Summer Worsley
18 min
tutorial
Karlijn Willems
33 min
tutorial
Karlijn Willems
35 min
tutorial
Parul Pandey
9 min
tutorial
Elena Kosourova
17 min