Seven Tricks for Better Data Storytelling: Part II

4. Use a narrative structure in data stories.
Stories generally follow a common arc – the protagonist faces a challenge, goes on to resolve it, then returns to normalcy. An example of this arc is the Hero’s Journey.
 Figure 1: The hero’s journey
The audience is 22 times more likely to remember a fact when told a story. Clearly, data visualizations stand to benefit from adopting the age-old narrative structure.
Adopting the narrative structure, a data story starts with a background on the current situation, continues with evidence that builds up to the central insight, and ends with a call to action. (Figure 2)
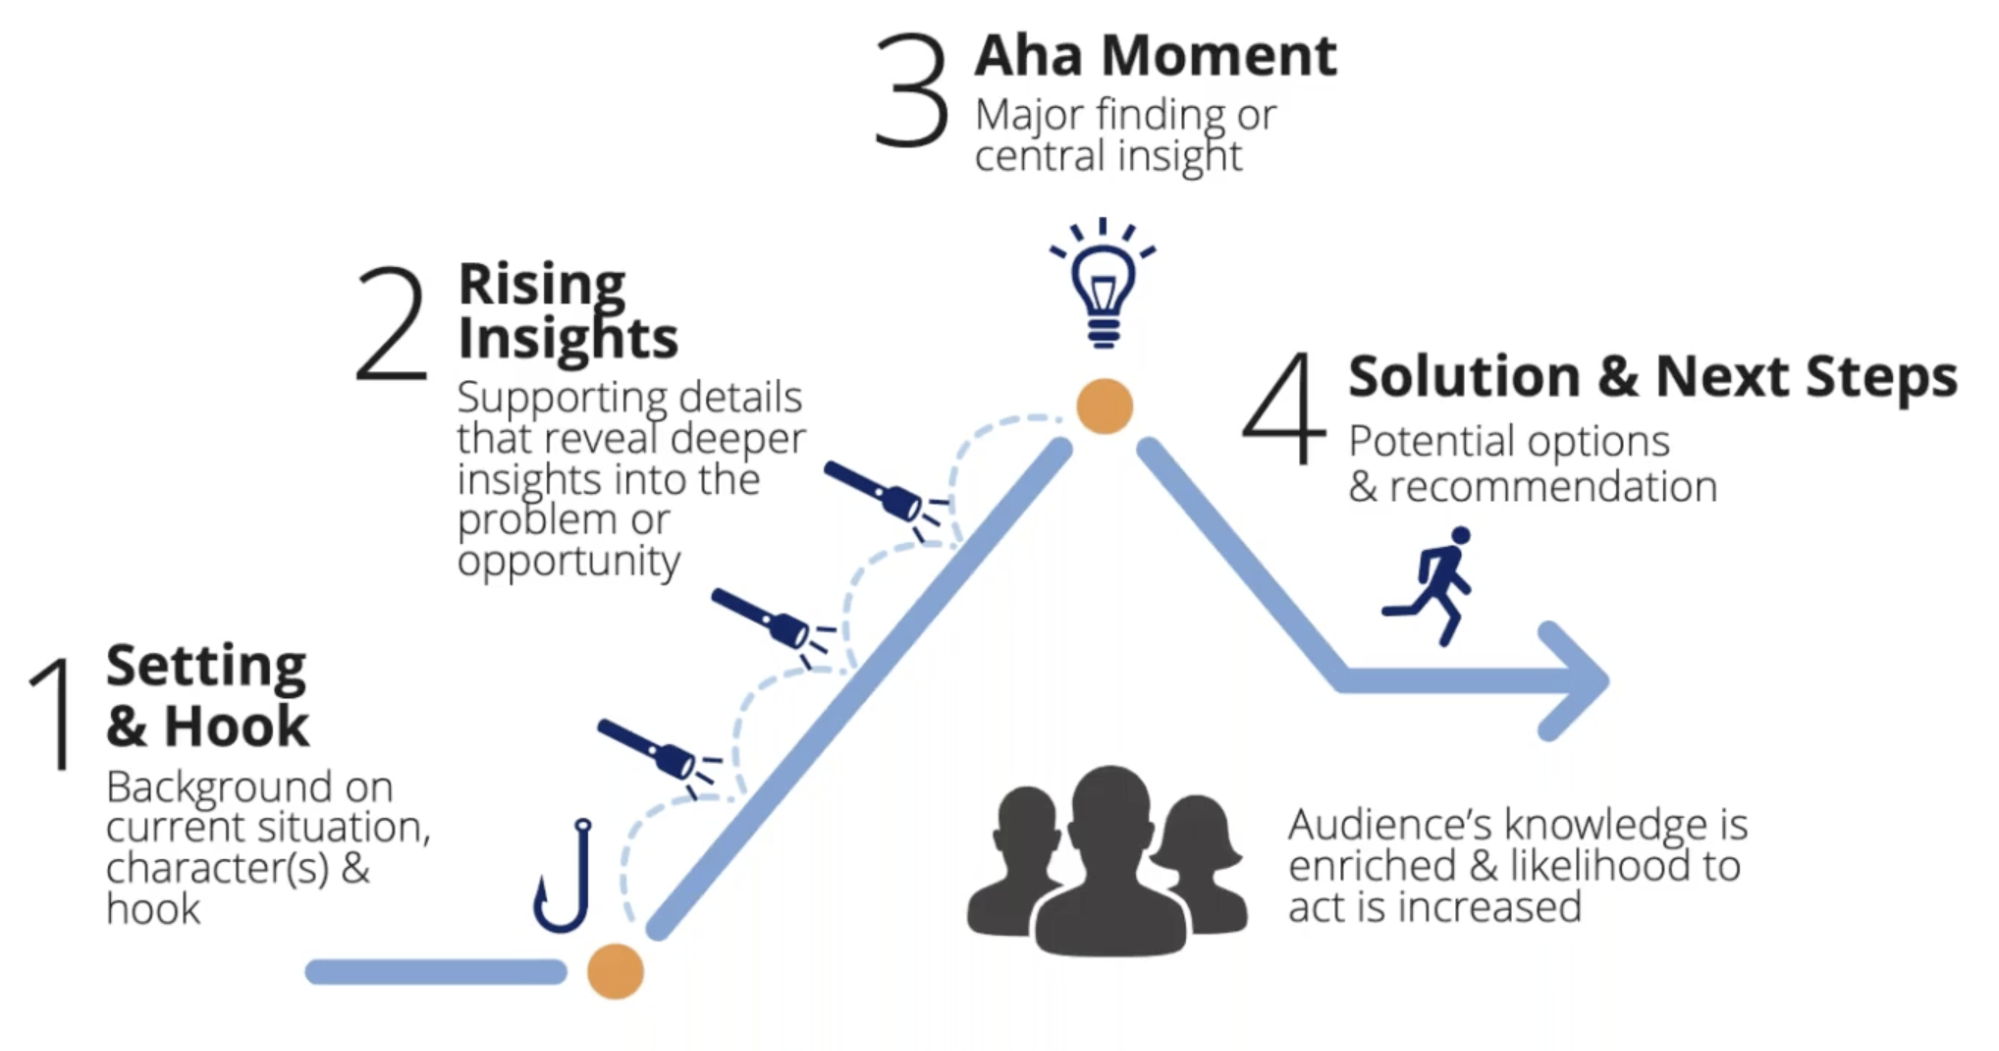 Figure 2. The narrative structure of a data story (Source: Effective Data Storytelling By Brent Dykes)
An excellent example of a data story, the Goalkeeper’s Report by the Gates Foundation demonstrated how the pandemic exacerbated inequality. (Figures 3A, 3B, and 3C)
 Figure 3A: To set the scene, the data story first established the impact of COVID-19 on poverty-stricken countries. [Source]
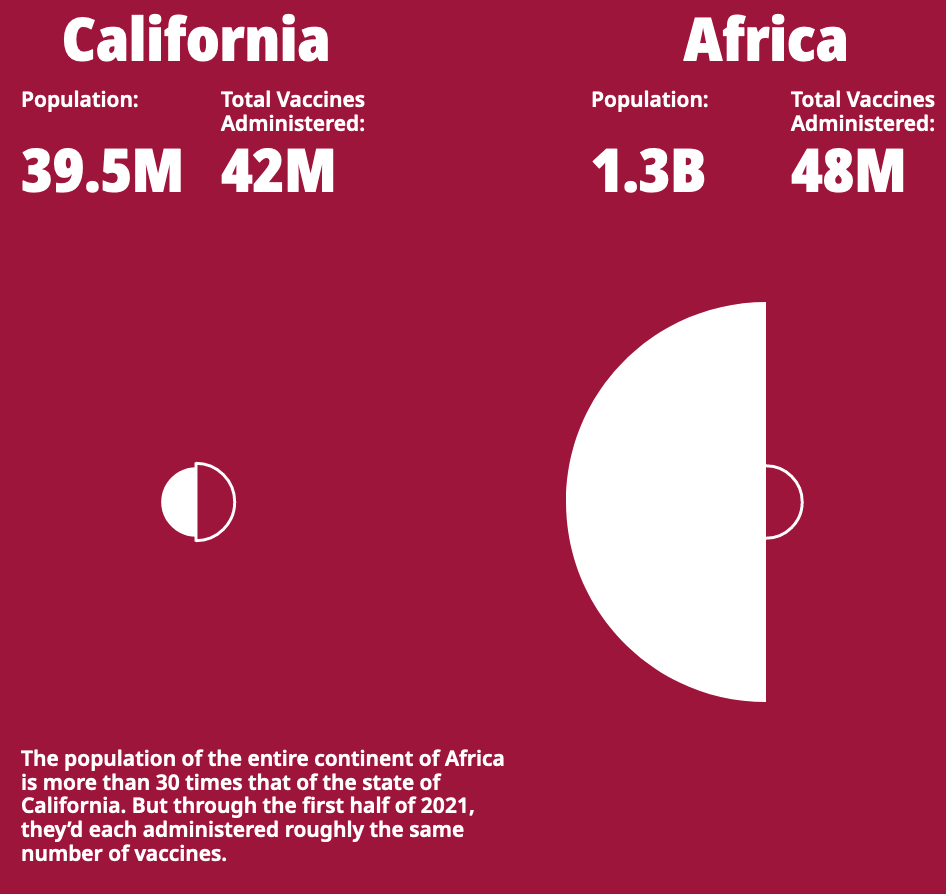 Figure 3B: The data story provided rising insights by highlighting the widening chasm between the haves and the have-nots pre-pandemic and post-pandemic.
 Figure 3C: The data story closes with a call to action–for greater investments in women, communities, and innovations.
5. Adapt data stories to the medium
It is tempting to reuse existing charts across multiple mediums. Data storytellers who do so are doing themselves a disservice.
Charts that are not optimized for their medium might fail to deliver their message effectively. A chart originally designed for email might contain minuscule texts that cannot be read on a screen.
The Economist portrayed how data stories can be adapted from print media to social media. The printed chart (designed for serious readers) was dense in information. It was streamlined for Instagram (designed for casual scrollers).
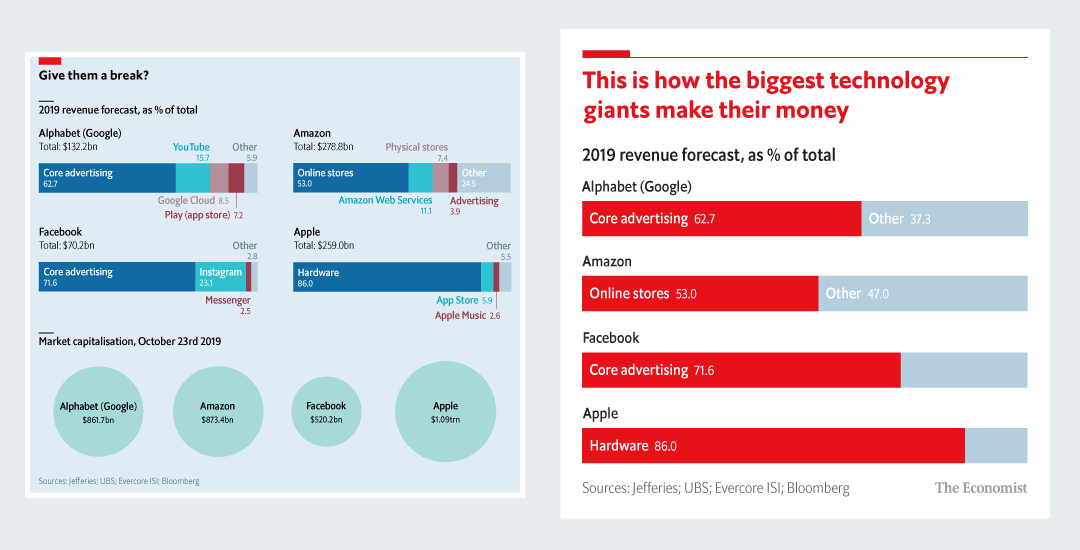 Figure 4: The Economist’s printed chart (left) is adapted for social media (right) [Source]
6. Declutter your data stories
Clutter makes data stories harder to read. The additional cognitive load distracts the audience from the main message.
The onus is on the data storyteller to identify and remove superfluous elements that do not contribute to the intended message. The result of decluttering is striking.
In particular, our whitepaper “8 Rules for Better Data Storytelling” suggests data storytellers to:
- Remove chart borders
- Remove gridlines or axes
- Clean up axis labels
- Label data directly (as opposed to using a legend)
- Remove data markers
- Use special effects (bold, underline, italics, shadows) sparingly
7. Explain data stories in stages
When presenting complex data stories, one practical tip is to reveal the elements of the chart gradually. When the information is presented in digestible pieces, the audience is more likely to engage with the presentation.
A prime example is the talk “The Joy of Stats” by Hans Rosling. Watch how Rosling masterfully told his data story.
Data storytelling is here to stay
Data storytelling will soon become a necessary skill set for all in the coming decade as data insights become a cornerstone of organizations. To learn more tips and tricks on data storytelling, listen to Andy’s podcast, or learn from his most recent webinar on DataCamp.
blog
A Data Science Roadmap for 2024

Mark Graus
10 min

podcast
Becoming Remarkable with Guy Kawasaki, Author and Chief Evangelist at Canva

Richie Cotton
55 min

podcast
The Venture Mindset with Ilya Strebulaev, Economist Professor at Stanford Graduate School of Business
Richie Cotton
59 min
cheat sheet
LaTeX Cheat Sheet
Richie Cotton
tutorial
Snscrape Tutorial: How to Scrape Social Media with Python

Amberle McKee
8 min
tutorial
AWS Storage Tutorial: A Hands-on Introduction to S3 and EFS

Zoumana Keita
16 min