PySpark Cheat Sheet: Spark DataFrames in Python
You'll probably already know about Apache Spark, the fast, general and open-source engine for big data processing; It has built-in modules for streaming, SQL, machine learning and graph processing. Spark allows you to speed analytic applications up to 100 times faster compared to other technologies on the market today. Interfacing Spark with Python is easy with PySpark: this Spark Python API exposes the Spark programming model to Python.
The PySpark Basics cheat sheet already showed you how to work with the most basic building blocks, RDDs.
Now, it's time to tackle the Spark SQL module, which is meant for structured data processing, and the DataFrame API, which is not only available in Python, but also in Scala, Java, and R. If you want to know more about the differences between RDDs, DataFrames, and DataSets, consider taking a look at Apache Spark in Python: Beginner's Guide.
Without further ado, here's the cheat sheet:
Have this cheat sheet at your fingertips
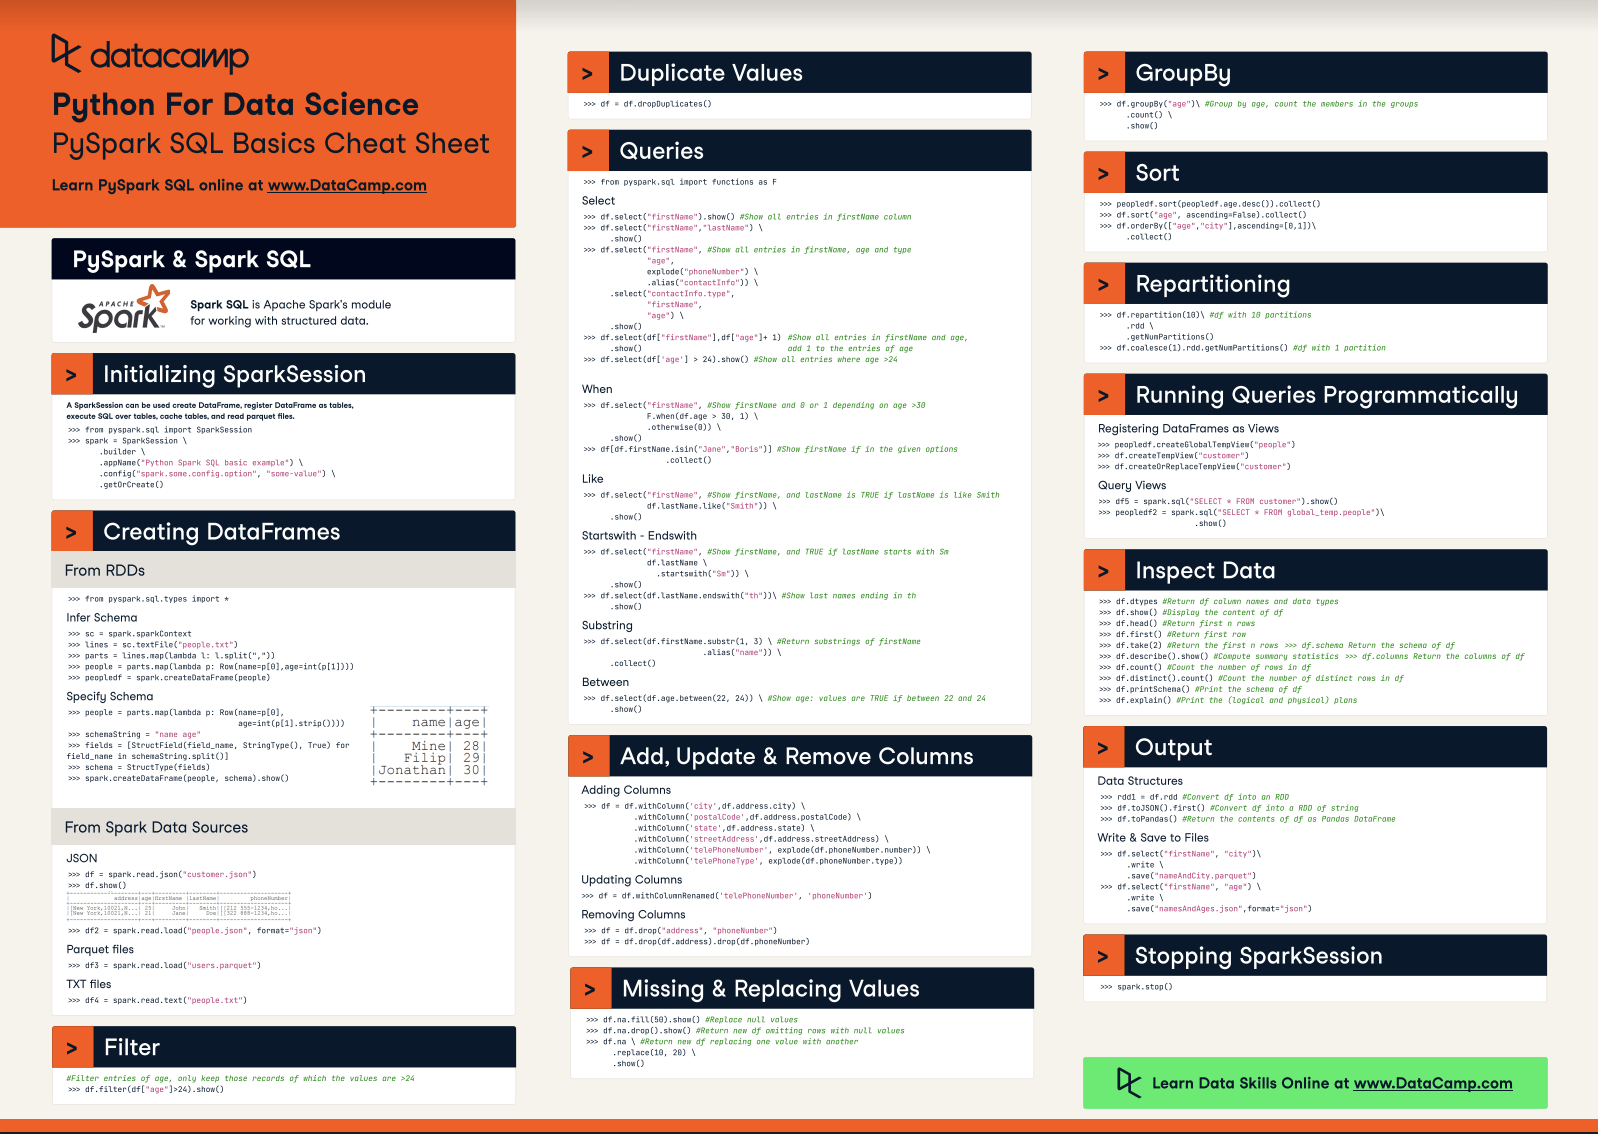
Download PDFThis PySpark SQL cheat sheet covers the basics of working with the Apache Spark DataFrames in Python: from initializing the SparkSession to creating DataFrames, inspecting the data, handling duplicate values, querying, adding, updating or removing columns, grouping, filtering or sorting data. You'll also see that this cheat sheet also on how to run SQL Queries programmatically, how to save your data to parquet and JSON files, and how to stop your SparkSession.
Make sure to check out our other Python cheat sheets for data science, which cover topics such as Python basics, Numpy, Pandas, Pandas Data Wrangling and much more!
 Spark SGlL is Apache Spark's module for working with structured data.
Initializing SparkSession
A SparkSession can be used create DataFrame, register DataFrame as tables, execute SGL over tables, cache tables, and read parquet files.
>>> from pyspark.sql import SparkSession>>> spark a SparkSession \ .builder\ .appName("Python Spark SQL basic example") \ .config("spark.some.config.option", "some-value") \ .getOrCreate()Creating DataFrames
Fromm RDDs
>>> from pyspark.sql.types import*Infer Schema
>>> sc = spark.sparkContext>>> lines = sc.textFile(''people.txt'')>>> parts = lines.map(lambda l: l.split(","))>>> people = parts.map(lambda p: Row(nameap[0],ageaint(p[l])))>>> peopledf = spark.createDataFrame(people)Specify Schema
>>> people = parts.map(lambda p: Row(name=p[0], age=int(p[1].strip())))>>> schemaString = "name age">>> fields = [StructField(field_name, StringType(), True) for field_name in schemaString.split()]>>> schema = StructType(fields)>>> spark.createDataFrame(people, schema).show()From Spark Data Sources
JSON
>>> df = spark.read.json("customer.json")>>> df.show()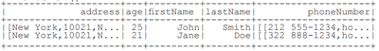
>>> df2 = spark.read.load("people.json", format="json")Parquet files
>>> df3 = spark.read.load("users.parquet")TXT files
>>> df4 = spark.read.text("people.txt")Filter
#Filter entries of age, only keep those records of which the values are >24>>> df.filter(df["age"]>24).show()Duplicate Values
>>> df = df.dropDuplicates()Queries
>>> from pyspark.sql import functions as FSelect
>>> df.select("firstName").show() #Show all entries in firstName column>>> df.select("firstName","lastName") \ .show()>>> df.select("firstName", #Show all entries in firstName, age and type "age", explode("phoneNumber") \ .alias("contactInfo")) \ .select("contactInfo.type", "firstName", "age") \ .show()>>> df.select(df["firstName"],df["age"]+ 1) #Show all entries in firstName and age, .show() add 1 to the entries of age>>> df.select(df['age'] > 24).show() #Show all entries where age >24When
>>> df.select("firstName", #Show firstName and 0 or 1 depending on age >30 F.when(df.age > 30, 1) \ .otherwise(0)) \ .show()>>> df[df.firstName.isin("Jane","Boris")] #Show firstName if in the given options.collect()Like
>>> df.select("firstName", #Show firstName, and lastName is TRUE if lastName is like Smith df.lastName.like("Smith")) \ .show()Startswith - Endswith
>>> df.select("firstName", #Show firstName, and TRUE if lastName starts with Sm df.lastName \ .startswith("Sm")) \ .show()>>> df.select(df.lastName.endswith("th"))\ #Show last names ending in th .show()Substring
>>> df.select(df.firstName.substr(1, 3) \ #Return substrings of firstName .alias("name")) \ .collect()Between
>>> df.select(df.age.between(22, 24)) \ #Show age: values are TRUE if between 22 and 24 .show()Add, Update & Remove Columns
Adding Columns
>>> df = df.withColumn('city',df.address.city) \ .withColumn('postalCode',df.address.postalCode) \ .withColumn('state',df.address.state) \ .withColumn('streetAddress',df.address.streetAddress) \ .withColumn('telePhoneNumber', explode(df.phoneNumber.number)) \ .withColumn('telePhoneType', explode(df.phoneNumber.type)) Updating Columns
>>> df = df.withColumnRenamed('telePhoneNumber', 'phoneNumber')Removing Columns
>>> df = df.drop("address", "phoneNumber") >>> df = df.drop(df.address).drop(df.phoneNumber) Missing & Replacing Values
>>> df.na.fill(50).show() #Replace null values >>> df.na.drop().show() #Return new df omitting rows with null values >>> df.na \ #Return new df replacing one value with another .replace(10, 20) \ .show()GroupBy
>>> df.groupBy("age")\ #Group by age, count the members in the groups .count() \ .show()Sort
>>> peopledf.sort(peopledf.age.desc()).collect()>>> df.sort("age", ascending=False).collect()>>> df.orderBy(["age","city"],ascending=[0,1])\ .collect()Repartitioning
>>> df.repartition(10)\ #df with 10 partitions .rdd \ .getNumPartitions()>>> df.coalesce(1).rdd.getNumPartitions() #df with 1 partitionRunning Queries Programmatically
Registering DataFrames as Views
>>> peopledf.createGlobalTempView("people")>>> df.createTempView("customer")>>> df.createOrReplaceTempView("customer")Query Views
>>> df5 = spark.sql("SELECT * FROM customer").show()>>> peopledf2 = spark.sql("SELECT * FROM global_temp.people")\ .show()Inspect Data
>>> df.dtypes #Return df column names and data types>>> df.show() #Display the content of df>>> df.head() #Return first n rows>>> df.first() #Return first row>>> df.take(2) #Return the first n rows >>> df.schema Return the schema of df>>> df.describe().show() #Compute summary statistics >>> df.columns Return the columns of df>>> df.count() #Count the number of rows in df>>> df.distinct().count() #Count the number of distinct rows in df>>> df.printSchema() #Print the schema of df>>> df.explain() #Print the (logical and physical) plansOutput
Data Structures
>>> rdd1 = df.rdd #Convert df into an RDD >>> df.toJSON().first() #Convert df into a RDD of string >>> df.toPandas() #Return the contents of df as Pandas DataFrameWrite & Save to Files
>>> df.select("firstName", "city")\ .write \ .save("nameAndCity.parquet") >>> df.select("firstName", "age") \ .write \ .save("namesAndAges.json",format="json")Stopping SparkSession
>>> spark.stop()Learn more about PySpark
Big Data Fundamentals with PySpark
cheat sheet
PySpark Cheat Sheet: Spark in Python

Karlijn Willems
6 min
cheat sheet
Pandas Cheat Sheet for Data Science in Python
Karlijn Willems
4 min
cheat sheet
Python for Data Science - A Cheat Sheet for Beginners
Karlijn Willems
4 min
cheat sheet
Pandas Cheat Sheet: Data Wrangling in Python
Karlijn Willems
4 min
tutorial
Apache Spark Tutorial: ML with PySpark
Karlijn Willems
34 min
tutorial
Pyspark Tutorial: Getting Started with Pyspark

Natassha Selvaraj
10 min