HomeCheat sheetsData Analysis

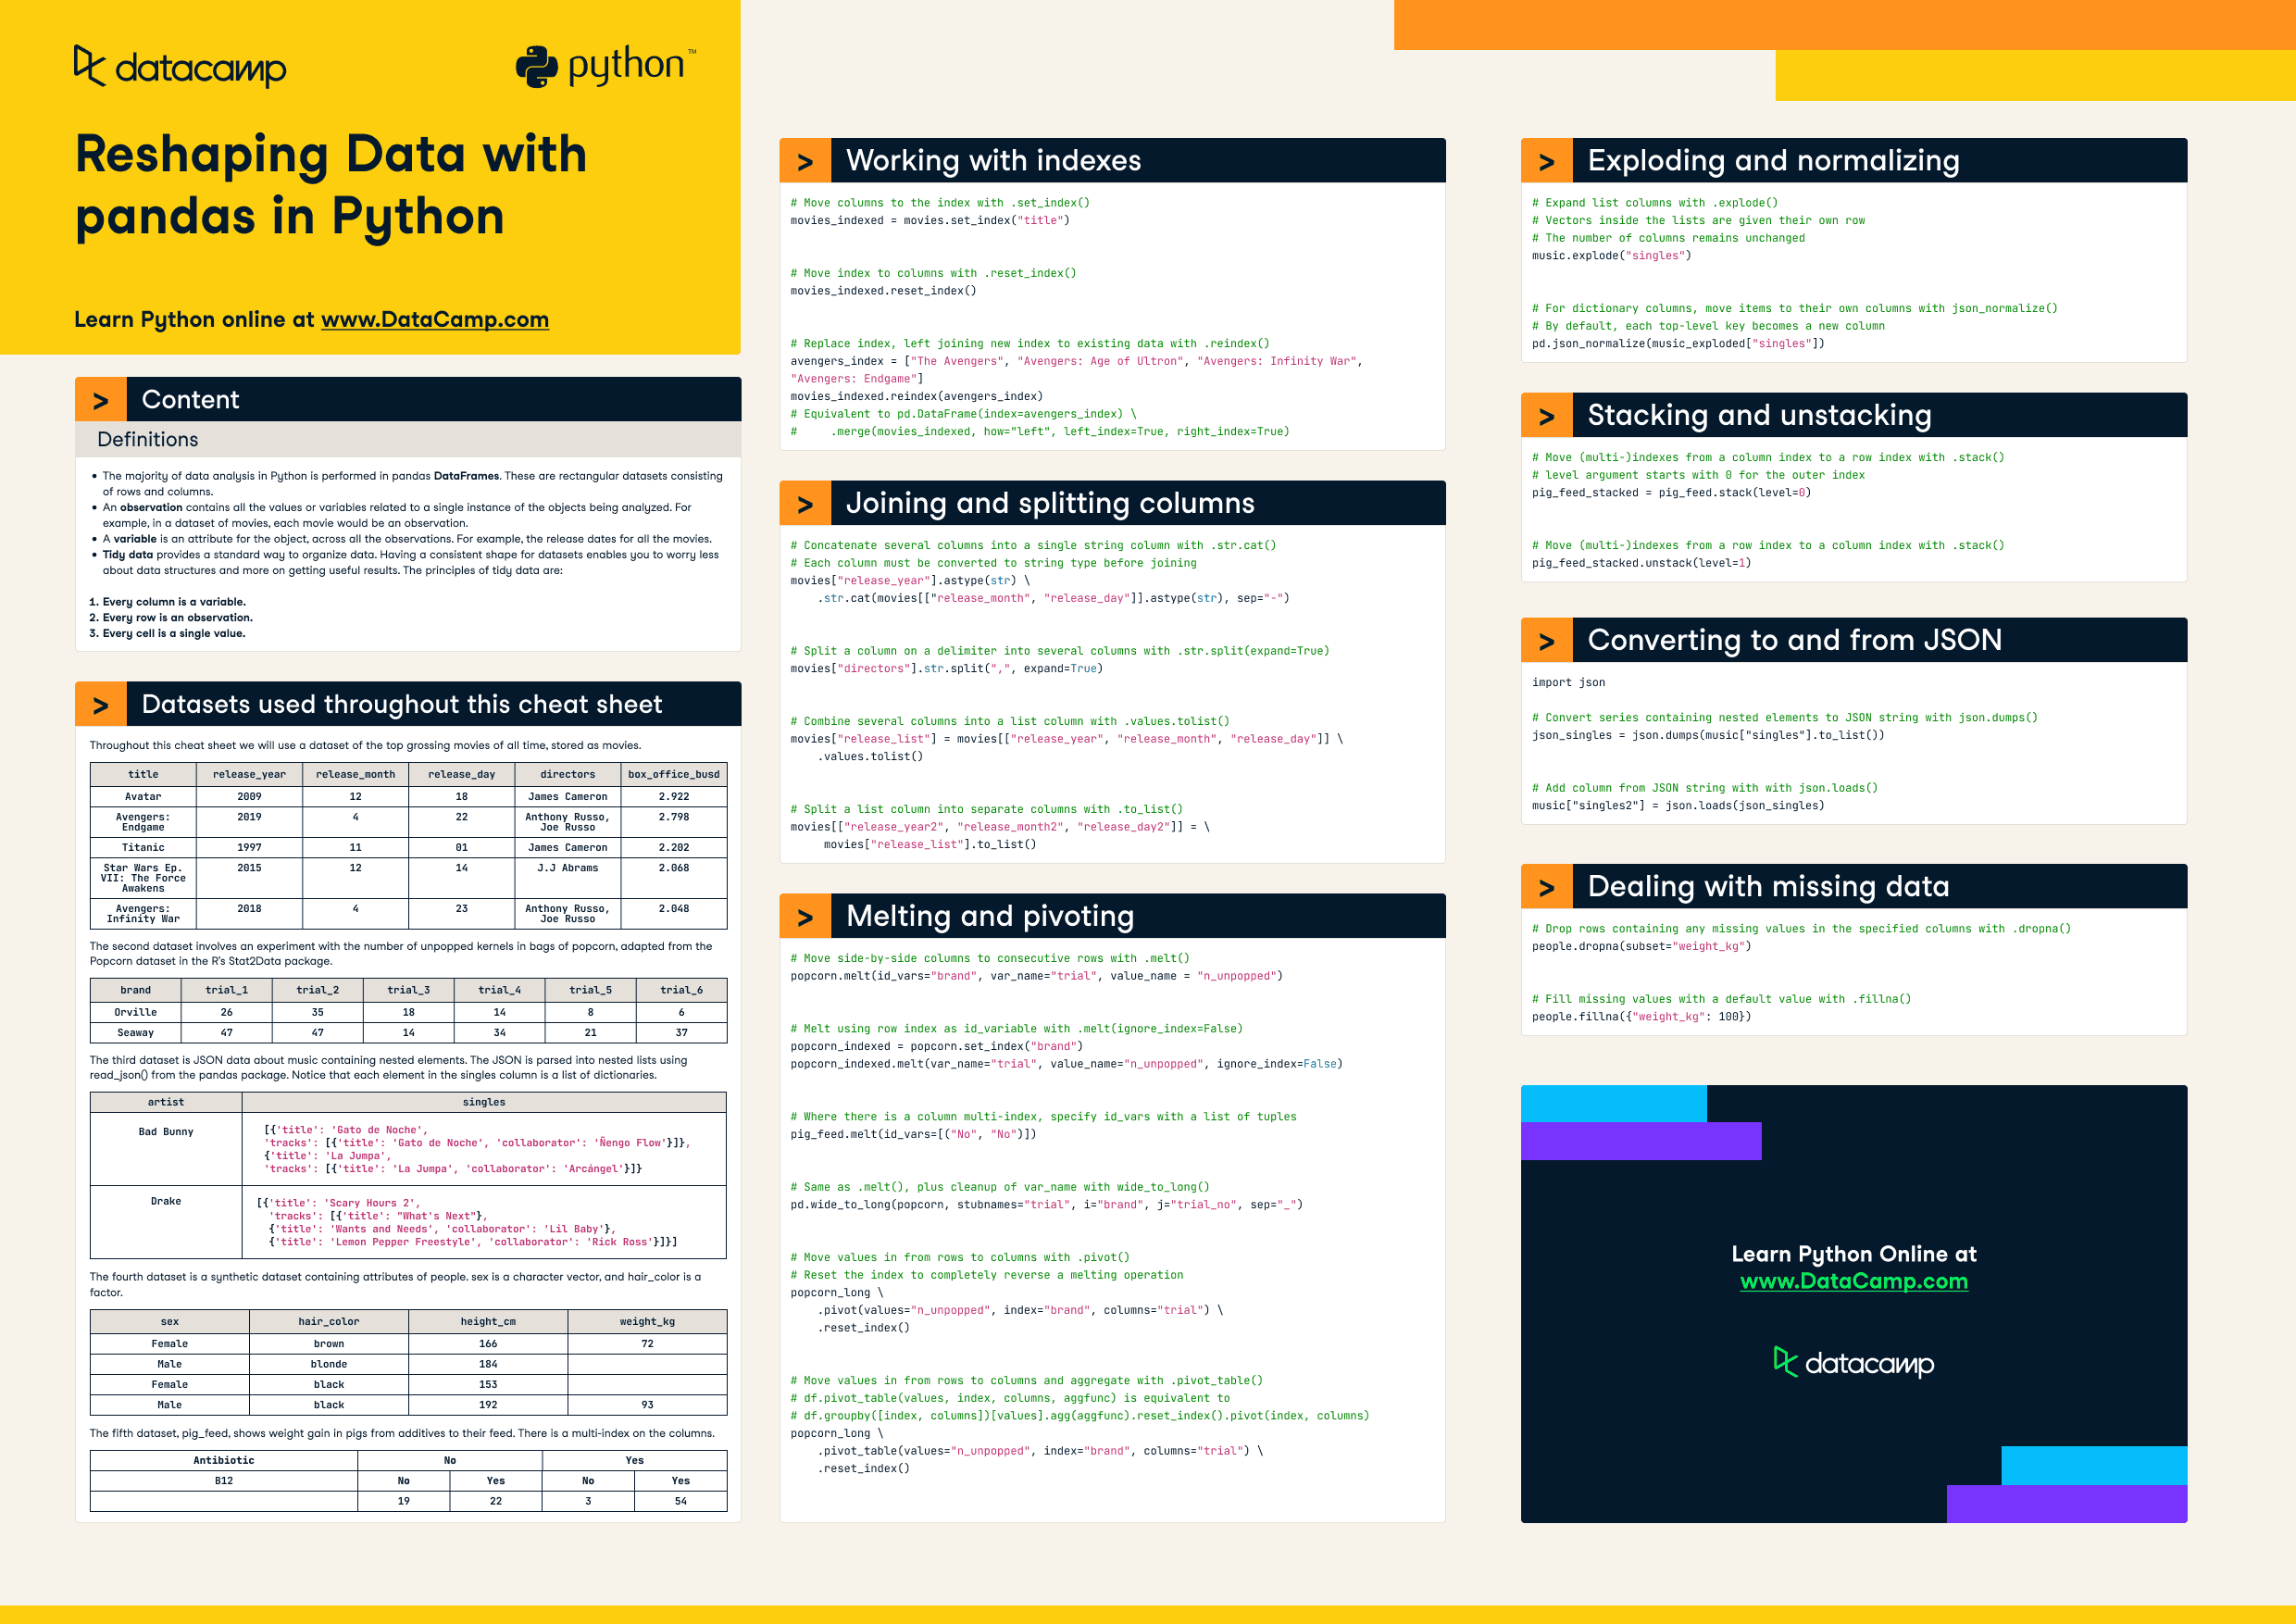
Reshaping Data with pandas in Python

Pandas DataFrames are commonly used in Python for data analysis, with observations containing values or variables related to a single object and variables representing attributes across all observations.
Feb 2023

Reshaping data with Python.png

Have this cheat sheet at your fingertips

Download PDF


Definitions

  • The majority of data analysis in Python is performed in pandas DataFrames. These are rectangular datasets consisting of rows and columns.
  • An observation contains all the values or variables related to a single instance of the objects being analyzed. For example, in a dataset of movies, each movie would be an observation. 
  • A variable is an attribute for the object, across all the observations. For example, the release dates for all the movies.
  • Tidy data provides a standard way to organize data. Having a consistent shape for datasets enables you to worry less about data structures and more on getting useful results. The principles of tidy data are:
    1. Every column is a variable.
    2. Every row is an observation.
    3. Every cell is a single value.

Datasets used throughout this cheat sheet

Throughout this cheat sheet we will use a dataset of the top grossing movies of all time, stored as movies.

title

release_year

release_month

release_day

directors

box_office_busd

Avatar

2009

12

18

James Cameron

2.922

Avengers: Endgame

2019

4

22

Anthony Russo,Joe Russo

2.798

Titanic

1997

11

01

James Cameron

2.202

Star Wars Ep. VII: The Force Awakens

2015

12

14

J. J. Abrams

2.068

Avengers: Infinity War

2018

4

23

Anthony Russo,Joe Russo

2.048

The second dataset involves an experiment with the number of unpopped kernels in bags of popcorn, adapted from the Popcorn dataset in the R's Stat2Data package.

brand

trial_1

trial_2

trial_3

trial_4

trial_5

trial_6

Orville

26

35

18

14

8

6

Seaway

47

47

14

34

21

37

The third dataset is JSON data about music containing nested elements. The JSON is parsed into nested lists using read_json() from the pandas package. Notice that each element in the singles column is a list of dictionaries.

artist

singles

Bad Bunny

[{'title': 'Gato de Noche',

  'tracks': [{'title': 'Gato de Noche', 'collaborator': 'Ñengo Flow'}]},

 {'title': 'La Jumpa',

  'tracks': [{'title': 'La Jumpa', 'collaborator': 'Arcángel'}]}]

Drake

[{'title': 'Scary Hours 2',

  'tracks': [{'title': "What's Next"},

   {'title': 'Wants and Needs', 'collaborator': 'Lil Baby'},

   {'title': 'Lemon Pepper Freestyle', 'collaborator': 'Rick Ross'}]}]

The fourth dataset is a synthetic dataset containing attributes of people. sex is a character vector, and hair_color is a factor.

sex

hair_color

height_cm

weight_kg

female

brown

166

72

male

blonde

184


female

black

153


male

black

192

93

The fifth dataset, pig_feed, shows weight gain in pigs from additives to their feed. There is a multi-index on the columns.

Antibiotic

No

Yes

B12

No

Yes

No

Yes


19

22

3

54

Working with indexes

# Move columns to the index with .set_index()
movies_indexed = movies.set_index("title")
# Move index to columns with .reset_index()
movies_indexed.reset_index()
# Replace index, left joining new index to existing data with .reindex()
avengers_index = ["The Avengers", "Avengers: Age of Ultron", "Avengers: Infinity War", "Avengers: Endgame"]
movies_indexed.reindex(avengers_index)
# Equivalent to pd.DataFrame(index=avengers_index) \

#     .merge(movies_indexed, how="left", left_index=True, right_index=True)

Joining and splitting columns

# Concatenate several columns into a single string column with .str.cat()
# Each column must be converted to string type before joining
movies["release_year"].astype(str) \
    .str.cat(movies[["release_month", "release_day"]].astype(str), sep="-")
# Split a column on a delimiter into several columns with .str.split(expand=True)
movies["directors"].str.split(",", expand=True)
# Combine several columns into a list column with .values.tolist()
movies["release_list"] = movies[["release_year", "release_month", "release_day"]] \
    .values.tolist()
# Split a list column into separate columns with .to_list()
movies[["release_year2", "release_month2", "release_day2"]] = \ 

    movies["release_list"].to_list()

Melting and pivoting

# Move side-by-side columns to consecutive rows with .melt()
popcorn.melt(id_vars="brand", var_name="trial", value_name = "n_unpopped")
# Melt using row index as id_variable with .melt(ignore_index=False)
popcorn_indexed = popcorn.set_index("brand")
popcorn_indexed.melt(var_name="trial", value_name = "n_unpopped", ignore_index=False)
# Where there is a column multi-index, specify id_vars with a list of tuples
pig_feed.melt(id_vars=[("No", "No")])
# Same as .melt(), plus cleanup of var_name with wide_to_long()

pd.wide_to_long(popcorn, stubnames="trial", i="brand", j="trial_no", sep="_")
# Move values in from rows to columns with .pivot()
# Reset the index to completely reverse a melting operation
popcorn_long \
    .pivot(values="n_unpopped", index="brand", columns="trial") \
    .reset_index()
# Move values in from rows to columns and aggregate with .pivot_table()
# df.pivot_table(values, index, columns, aggfunc) is equivalent to
# df.groupby([index, columns])[values].agg(aggfunc).reset_index().pivot(index, columns)
popcorn_long \
    .pivot_table(values="n_unpopped", index="brand", columns="trial") \
    .reset_index()

Exploding and normalizing

# Expand list columns with .explode()
# Vectors inside the lists are given their own row
# The number of columns remains unchanged
music.explode("singles")
# For dictionary columns, move items to their own columns with json_normalize()
# By default, each top-level key becomes a new column
pd.json_normalize(music_exploded["singles"])

Converting to and from JSON

import json
# Convert series containing nested elements to JSON string with json.dumps()
json_singles = json.dumps(music["singles"].to_list())
# Add column from JSON string with with json.loads()
music["singles2"] = json.loads(json_singles)

Stacking and unstacking

# Move (multi-)indexes from a column index to a row index with .stack()
# level argument starts with 0 for the outer index
pig_feed_stacked = pig_feed.stack(level=0)
# Move (multi-)indexes from a row index to a column index with .stack()
pig_feed_stacked.unstack(level=1)

Dealing with missing data

# Drop rows containing any missing values in the specified columns with .dropna()
people.dropna(subset="weight_kg")
# Fill missing values with a default value with .fillna()
people.fillna({"weight_kg": 100})


Related

Working with Pivot Tables in Excel

Learn how to organize rows and columns, add values, find the sum of a value, and apply filtering to select a subset of a given dataset. We’ll learn how to apply this in Excel with a retail dataset example.
Jess Ahmet's photo

Jess Ahmet

9 min

How to Create a Data Analyst Resume

In this article, we'll discuss how to create a data analyst resume that will get you hired.
Matt Crabtree's photo

Matt Crabtree

7 min

Gary Wolf- Dataframed 119.png

Data-Driven Thinking for Everyday Life

Gary Wolf talks about what The Quantified Self is, why self-tracking projects can be life-changing, how to get started with self-tracking, and how to connect with others.

Richie Cotton's photo

Richie Cotton

55 min

Reshaping Data with tidyr in R

In this cheat sheet, you will learn how to reshape data with tidyr. From separating and combining columns, to dealing with missing data, you'll get the download on how to manipulate data in R.
Richie Cotton's photo

Richie Cotton

6 min

Data Quality Dimensions Cheat Sheet

In this cheat sheet, you'll learn about data quality dimensions, allowing you to ensure that your data is fit for purpose.
Joe Franklin's photo

Joe Franklin

3 min

Top Techniques to Handle Missing Values Every Data Scientist Should Know

Explore various techniques to efficiently handle missing values and their implementations in Python.
Zoumana Keita 's photo

Zoumana Keita

15 min

See MoreSee More