HomeTutorialsSpreadsheets

How to Calculate Percentiles in Excel

In this tutorial, we'll explore what percentiles are, what they are used for, the ways of calculating them in Excel, simple examples of such calculations, and possible errors to be aware of when computing percentiles in Excel.
Updated Mar 2024  · 8 min read

Percentiles represent a popular concept and practical method widely used in statistics and having various real-world applications. Because of their usefulness, the great majority of modern programs and programming languages allow easy calculation of percentiles. Microsoft Excel is one such tool.

This tutorial will explore what percentiles are, what they are used for, how to calculate them in Excel, simple examples of such calculations, and possible errors to be aware of when computing percentiles in Excel.

If you need to learn or revise the basics of Excel for impactful data analysis, consider exploring DataCamp’s Introduction to Excel course and Excel Formulas Cheat Sheet.

What Percentiles Are and What They Are Used For?

A percentile, or centile, is a value of a variable of interest at or below (or strictly below) which a defined percent of values of that variable fall. In practice, we usually speak about a k-th percentile, where the value of k defines the percent of values of the variable in interest. A specific case of a k-th percentile is the median of a variable of interest, which is virtually its 50th percentile.

There are two things to note in the above definition:

  • Whether we opt for "at or below" or "strictly below" determines if our percentile definition is inclusive or exclusive.
  • Despite their name, percentiles are measured in the same units as the variable itself rather than in percent.

To illustrate the concept of percentiles using a simple example, if a movie rating on a movie ranking website falls within the 87th percentile, this means that the movie was ranked better than 87% of all the films on that website.

Percentiles are extensively used in statistical analysis, test score reporting, threshold identification, and ranking systems.

To refresh your knowledge of the most common descriptive analytics statistical techniques, refer to the Descriptive Statistics Cheat Sheet.

How to Calculate Percentiles in Excel

Excel offers two main functions for calculating percentiles: PERCENTILE.INC and PERCENTILE.EXC.

Strictly speaking, there is also the third function—PERCENTILE—that was used in old versions of the software (Excel 2007 and earlier) and is now kept for compatibility purposes. This old function works in the same way as PERCENTILE.INC.

In this tutorial, we're going to focus on the newer functions—PERCENTILE.INC and PERCENTILE.EXC.

PERCENTILE.INC Excel Function

Syntax

PERCENTILE.INC(array, k)

where:

  • array—the array or range of data for which the percentile is calculated,
  • k—the percentile value in the range from 0 to 1, inclusive.

Both arguments are required.

The PERCENTILE.INC function returns the k-th percentile of values in a range, where k is in the range from 0 to 1, including the values 0 and 1. In other words, this function includes the first and last values of the array.

Algorithm

Under the hood, the PERCENTILE.INC Excel function performs the following steps:

  1. Sorts the values of the provided array in ascending order.
  2. Determines the percentile value based on the k argument and the number N of data points in the array using the formula: k(N-1) + 1.
  3. If the result of the previous step isn't an integer, the algorithm interpolates between the nearest values of the array.

Example

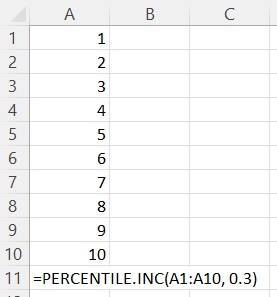
Let's say we want to calculate the 30th percentile for an array of integers from 1 to 10 inclusive, using the PERCENTILE.INC Excel function. Here is what our formula will look like:

Calculating the 30th percentile for an array of integers from 1 to 10 inclusive, using the PERCENTILE.INC Excel formula.

Note: While the values of the above array are sorted for illustrative purposes, we don't actually need to sort the values in advance since the algorithm will do it for us behind the scenes.

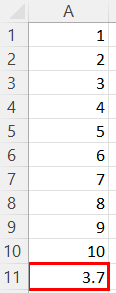
Below is the result of our calculation:

The result of calculating the 30th percentile for an array of integers from 1 to 10 inclusive, using the PERCENTILE.INC Excel formula.

Possible Errors

  • #NUM!— when the provided array is empty, or k < 0, or k > 1.
  • #VALUE!—when k is non-numeric.

PERCENTILE.EXC Excel Function

Syntax

PERCENTILE.EXC(array, k)

where:

  • array—the array or range of data for which the percentile is calculated,
  • k—the percentile value in the range from 0 to 1, exclusive.

Both arguments are required.

The PERCENTILE.EXC function returns the k-th percentile of values in a range, where k is in the range from 0 to 1, excluding the values 0 and 1. More precisely, for an array with N data points, the value of k should satisfy both of the following conditions:

  1. K > 1/(N+1)
  2. K < N/(N+1)

Put it simply, the PERCENTILE.EXC function excludes the first and last values of the array.

Algorithm

Under the hood, the PERCENTILE.EXC Excel function performs the following steps:

  1. Sorts the values of the provided array in ascending order.
  2. Determines the percentile value based on the k argument and the number N of data points in the array using the formula: k(N+1).
  3. If the result of the previous step isn't an integer, the algorithm interpolates between the nearest values of the array.

Example

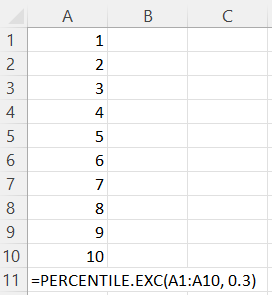
Let's say, we want to calculate the 30th percentile for an array of integers from 1 to 10 inclusive, using the PERCENTILE.EXC Excel function. Here is what our formula will look like:

Calculating the 30th percentile for an array of integers from 1 to 10 inclusive, using the PERCENTILE.EXC Excel formula.

Note: While the values of the above array are sorted for illustrative purposes, we don't actually need to sort the values in advance since the algorithm will do it for us behind the scenes.

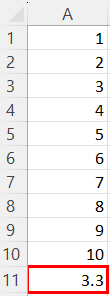
Below is the result of our calculation:

The result of calculating the 30th percentile for an array of integers from 1 to 10 inclusive, using the PERCENTILE.EXC Excel formula.

Possible Errors

  • #NUM!— when the provided array is empty, or k <= 1/(N+1), or k >= N/(N+1).
  • #VALUE!—when k is non-numeric.

To learn or refresh other popular Excel functions, check out this tutorial: The 15 Basic Excel Formulas Everyone Needs to Know.

PERCENTILE.INC VS. PERCENTILE.EXC in Excel

So far, we can clearly see a lot of similarities between the PERCENTILE.INC and PERCENTILE.EXC Excel functions. However, there are also distinct differences between them that make them two separate functions and result in their different outcomes. Let's recap how the PERCENTILE.INC and PERCENTILE.EXC functions in Excel are similar and how they differ.

Similarities:

  1. Function syntax.
  2. Overall algorithm logic (except for the formula used to determine the percentile value).
  3. Possible errors (#NUM! when the array is empty or k is out of its possible range and #VALUE! when k is non-numeric).

Differences:

  1. The possible range for the k argument:
    • PERCENTILE.INC—from 0 to 1, inclusive.
    • PERCENTILE.EXC—from 1/(N+1) to N/(N+1), exclusive.
  2. Treating the values of an array:
    • PERCENTILE.INC—includes the first and last values.
    • PERCENTILE.EXC—excludes the first and last values.
  3. Formula to determine the percentile value:
    • PERCENTILE.INC—k(N-1) + 1.
    • PERCENTILE.EXC—k(N+1).

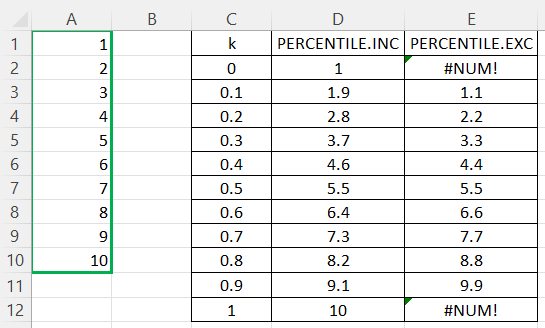
Let's see the PERCENTILE.INC and PERCENTILE.EXC Excel functions in action by applying both of them on the same array of integer numbers from 1 to 10 inclusive and playing with different values of k:

Comparing the results of calculating various percentiles for an array of integers from 1 to 10 inclusive, using the PERCENTILE.INC and PERCENTILE.EXC functions in Excel.

The above table demonstrates the limitations of the PERCENTILE.EXP function when it comes to calculating percentiles for too low or too high values of k (more precisely, when k <= 1/(N+1) or k >= N/(N+1)), as well as pairwise differences in the outcomes for each value of k that increase towards the extreme values of k and can be explained by the computational differences of the underlying algorithms.

On the other hand, we should keep in mind that in the predominant majority of cases, too low or too high values of k are of no particular value for us from the standpoint of statistics. Hence, these limitations aren't normally an issue. Besides, in real life, we usually need to calculate percentiles for much larger arrays than the one from our example above, which mitigates the outcome differences.

In most cases, it makes more sense to opt for the PERCENTILE.INC Excel function, which also matches the default formulas used to calculate percentiles in many programming languages, including Python and R.

However, if, for whatever reason, we don't trust the first and last values of our dataset, considering them statistically unrepresentative, then the PERCENTILE.EXP function can be a better choice since it will exclude those values from calculations.

It's important to have clean and representative data to extract valuable business insights from it. The Data Preparation in Excel course and Data Manipulation in Excel Cheat Sheet are helpful resources for learning how to efficiently prepare your data for further analysis.

Conclusion

We’ve discussed the essential statistical theory behind percentiles, their definition, the major areas of their application, and the two main functions used for calculating percentiles in Excel, including their syntax, algorithms, calculation examples, and potential errors.

We’ve also compared the two Excel functions, outlined their similarities and important differences, put both functions in action on the same data array to confront the results, and learned the best scenario for each of them.

To unlock the full power of Excel, consider taking a beginner-friendly Excel Fundamentals skill track, which will help you learn, through hands-on exercises, both basic and advanced features and formulas used for data preparation, visualization, and analysis in Excel.


Photo of Elena Kosourova
Author
Elena Kosourova
Topics

Keep Learning Excel!

Track

Excel Fundamentals

16hrs hr
Gain the essential skills you need to use Excel, from preparing data to writing formulas and creating visualizations. No prior experience is required.
See DetailsRight Arrow
Start Course
See MoreRight Arrow
Related

Top 32 AWS Interview Questions and Answers For 2024

A complete guide to exploring the basic, intermediate, and advanced AWS interview questions, along with questions based on real-world situations. It covers all the areas, ensuring a well-rounded preparation strategy.
Zoumana Keita 's photo

Zoumana Keita

15 min

Avoiding Burnout for Data Professionals with Jen Fisher, Human Sustainability Leader at Deloitte

Jen and Adel cover Jen’s own personal experience with burnout, the role of a Chief Wellbeing Officer, the impact of work on our overall well-being, the patterns that lead to burnout, the future of human sustainability in the workplace and much more.
Adel Nehme's photo

Adel Nehme

44 min

Becoming Remarkable with Guy Kawasaki, Author and Chief Evangelist at Canva

Richie and Guy explore the concept of being remarkable, growth, grit and grace, the importance of experiential learning, imposter syndrome, finding your passion, how to network and find remarkable people, measuring success through benevolent impact and much more. 
Richie Cotton's photo

Richie Cotton

55 min

How to Use HLOOKUP in Excel

A beginner-friendly, comprehensive tutorial in mastering the HLOOKUP function in Microsoft Excel.
Arunn Thevapalan's photo

Arunn Thevapalan

6 min

Linear Regression in Excel: A Comprehensive Guide For Beginners

A step-by-step guide on performing linear regression in Excel, interpreting results, and visualizing data for actionable insights.
Natassha Selvaraj's photo

Natassha Selvaraj

11 min

How to Calculate Factorials in Excel: A Complete Guide

Learn to calculate factorials in Excel with ease. Discover FACT, FACTDOUBLE, GAMMA functions, and more to solve mathematical and real-world problems.
Elena Kosourova's photo

Elena Kosourova

7 min

See MoreSee More