Course
Data Analysis in Google Sheets
3 hr
11K
As a manager of a company, you always have finite or limited resources, and top management's expectation is for you to make the most out of it. From time productivity to capital utilization, land to labor, and from supply chain to production-almost everything you do is to optimize productivity.
A majority of airlines optimize flight schedules to get the highest revenue and lowest cost. These airlines schedules involve a lot of situations and restrictions such as the number of planes at a particular location, fuel, crew, and type of route (popular and profitable routes). These situations and restrictions are known as the constraints of flying planes on the most popular and profitable route. Linear programming is used to find the solution for the given constrained problem.
In this tutorial, you are going to learn about linear programming, and the following topics will be covered:
Mathematically, linear programming optimizes (minimizes or maximizes) the linear objective of several variables subject to the given conditions/constraints that satisfies a set of linear inequalities. Linear programming can be applied in planning economic activities such as transportation of goods and services, manufacturing products, optimizing the electric power systems, and network flows. LP problems can be solved using different techniques such as Graphical, Simplex, and Karmakar's method.
Let's see the basic terminologies of linear programming:
Decision variables are the variables which will be used as a function of the objective function. These variables decide your output. The decision maker can control the value of an objective function using the decision variable. When you solve any linear programming problem, you first need to identify the decision variables.
Constraints are a set of restrictions or situational conditions. Constraints can be in equalities or inequalities form. Constraints restrict the value of decision variables.
The objective function is a profit or cost function that maximizes or minimize. It is the main target of making decisions.
The optimal solution is one of the feasible solutions where the objective function is either maximum or minimum, for example, maximum profit or minimum cost. It is the best value of the objective function.
A feasible solution is the set of possible values for decision variables that meets all of the constraints. LP problem is feasible if at least one solution is feasible.
The infeasible solution is the set of possible values for decision variables that do not meet all the constraints, i.e., there is no optimal solution. LP problem is an infeasible solution if no solution exists that meets all of the constraints.
The feasible region is a region which covered from all the possible set of values that meet the constraints or intersection of all the constraints. It includes all the inequalities, equalities, and integer constraints.
Non-negativity constraints for decision variables which accept only non-negative values. Such constraints are greater than or equal to zero.
Formulating linear programming models involves the following steps:
In a linear programming problem, the decision variables, objective function, and constraints all have to be a linear function
Problem Statement: A furniture dealer deals in only two items–tables and chairs. He has Rs 50,000 to invest and has storage space of at most 60 pieces. A table costs Rs 2500 and a chair Rs 500. He estimates that from the sale of one table, he can make a profit of Rs 250 and from the sale of one chair a profit of Rs 75. He wants to know how many tables and chairs he should buy from the available money to maximize his total profit, assuming that he can sell all the items which he buys. (Source)
In this example, you observe that –
Mathematical Formulation:
Let’s suppose he decides to purchase tables only and no chairs. So, he can buy 50000/2500 = 20 tables. In this case, he will earn a profit of 250 x 20 = Rs. 5000. Or he decides to purchase chairs only and no tables. So, he can buy 50000/500 = 100 chairs.
In this case, he will earn a profit of 75 x 60 = Rs. 4500.
There could be many combinations of tables and chairs he could buy.
Let’s suppose he purchases X number of tables and Y number of chairs. So X and Y must be non-negative.
The dealer has a maximum amount of Rs. 50000 to purchase tables and chairs hence –
2500 X + 500 Y <= 50000 (Investment constraints) or 5 * X + Y <= 100 ………………………………………………………. Eq.1
The maximum number of units he can store is 60.
X + Y <= 60 ………………………………………………………. Eq.2
The dealer wants to purchase in such quantities so he can maximize his profit Z, hence the equation would be –
Max Z : 250 X + 75 Y
Objective function: Max Z: 250 X + 75 Y
Subjected to constraints:
5 * X + Y <= 100,
X + Y <= 60 and
X,Y >= 0
Source: http://ncert.nic.in/ncerts/l/lemh206.pdf
Linear Programming Example
Objective function: Max Z: 250 X + 75 Y
Subjected to constraints:
5 * X + Y <= 100,

X + Y <= 60 and

Where X,Y >= 0
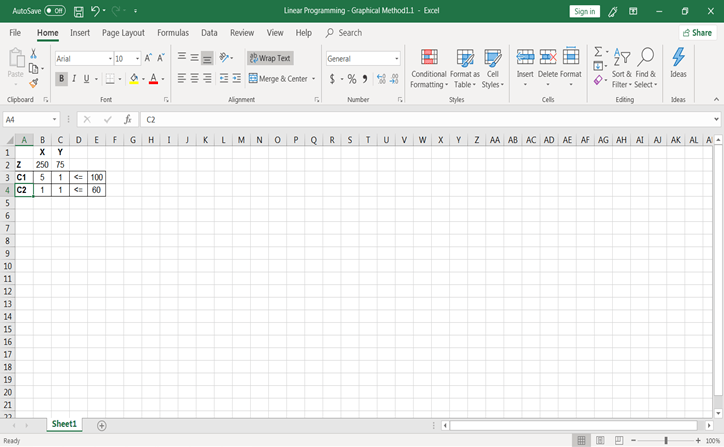
Step 1: Let’s write the function in excel like shown below.
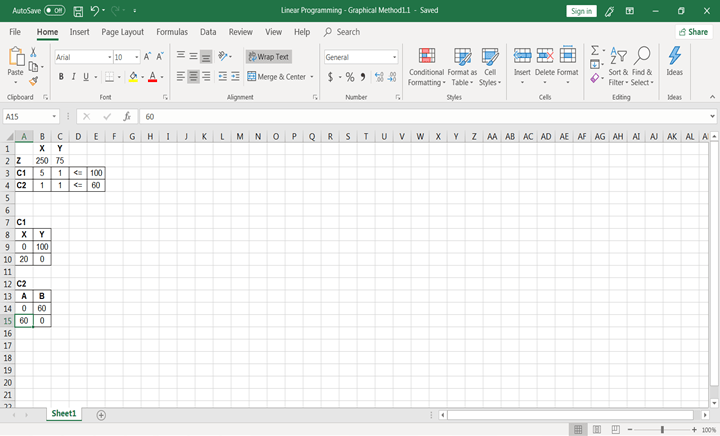
Step 2: After writing objective function and constraints in the spreadsheet, let's calculate values for constraints C1 and C2. You can calculate values of by putting another variable value to zero. Like for C1, at X = 0, Y’s value would be Y = 100 and at Y = 0, X’s value would be X = 20. Similarly, for constraints C2.
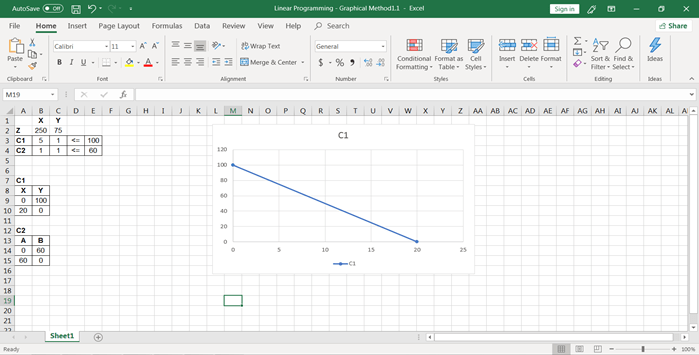
Step-3: Now, after calculating values, let’s plot the graph. Select C1 constraints values, go to insert and plot the scatter chart with smoothed lines. You might see your chart like this.
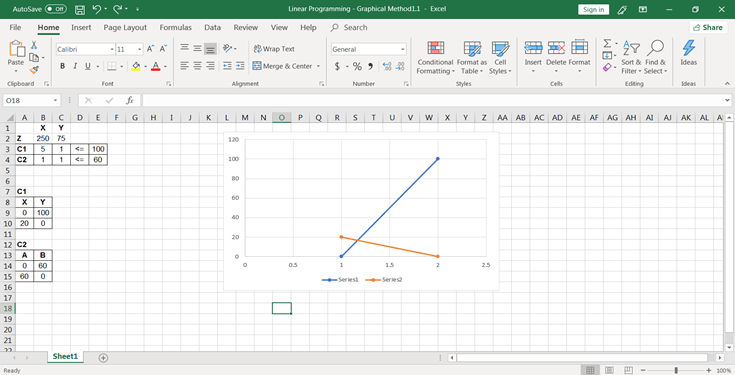
If it looks like this, don’t worry, follow the below steps to change it. Right-click on the chart, go to Select Data, you will see two series there, remove Series 2 and Edit series 1.
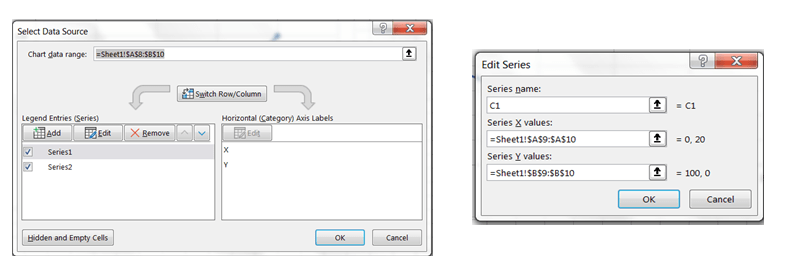
Name series as C1 and change its X value to C1’s A column values and Y value to C1’s B column values. And Click on, Ok. You will see your chart like the one below:
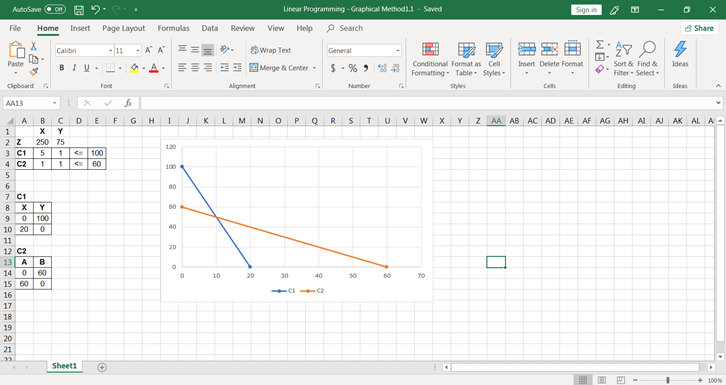
Step-4: 4. Again, go to Select Data by right-clicking on the chart and add another series. Name it C2 and in X values select constraints C2 X column values and in Y values select constraints C2 Y column values. Your chart will look like the one below:
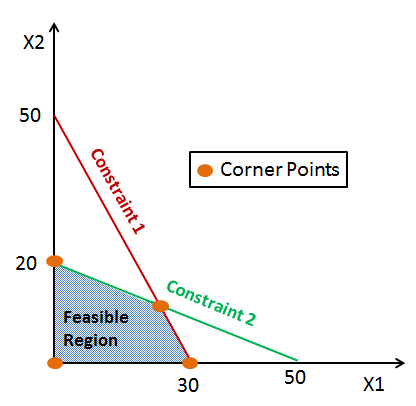
Step-5: Now the graph has been plotted, and you need to look at the feasible region:
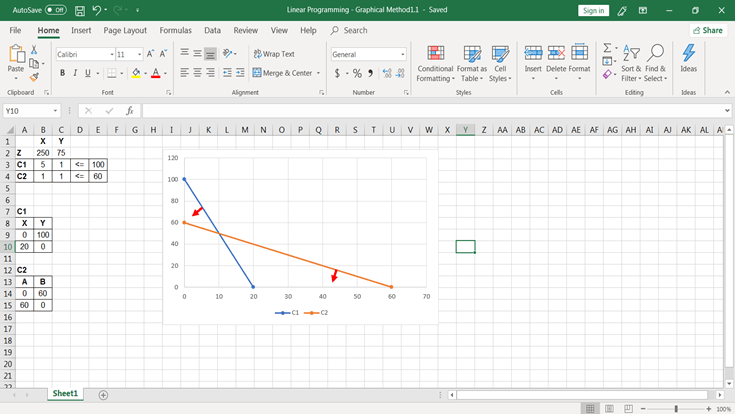
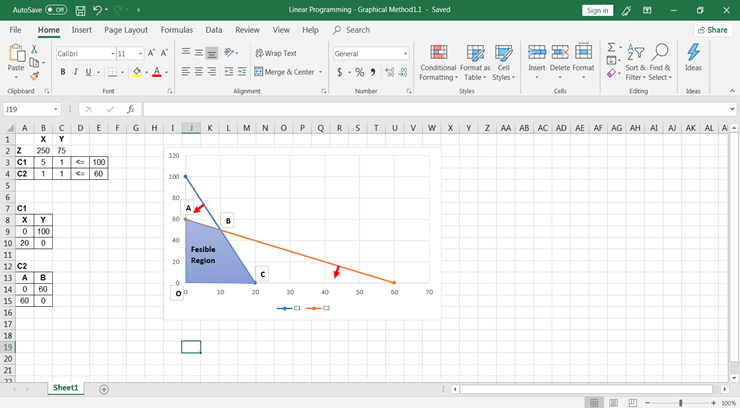
Now you have 4 points (O, A, B, C) at feasible region area, you need to calculate objective function values at all the points to see which point gives you the maximum value of the objective.
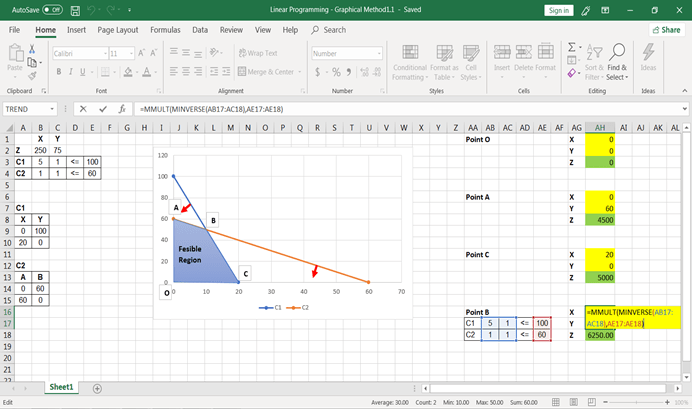
Step-6: To calculate objective function values, Follow the below steps:
Calculate the objective function for each value of point:
At point C To find the coordinate values at point Z, you need to find the intersection point of constrains line C1 and C2. You will use MMULT() and MINVERSE() function to calculate the intersection of two equations.
MMULT(MINVERSE(array),array) # This gives the values of the solution of equations with two variables Or, =MMULT(MINVERSE(AB17:AC18), AE17:AE18), Before using this formula, select X and Y values cells yellow highlighted cells and use this function to calculate intersection point of two equation and press CTRL+SHIFT+ENTER
The final values of Z:
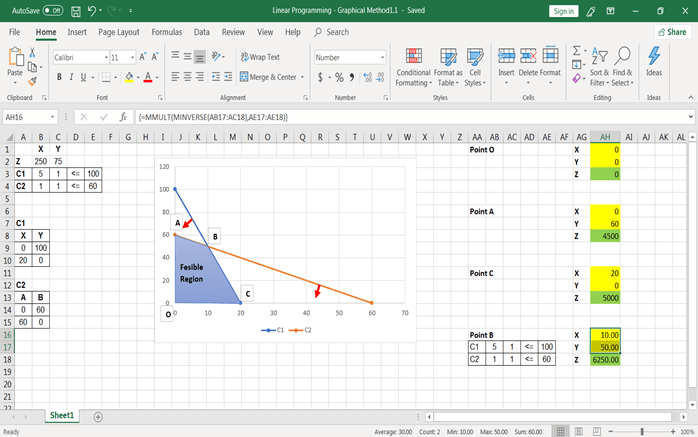
As you can see here in this linear maximization problem, you have got Z’s maximum value at Point B, and the maximum value is Rs. 6250. Hence, in order to maximize profit, the dealer must purchase 10 tables and 50 chairs.
Linear programming is applied to find optimal solutions for operations research. LP can find the most optimum solution in given constraints and restrictions. LP is applicable in all kinds of problems such as economic activities in agriculture, engineering, manufacturing, energy, logistics, and supply chain.
Engineers apply linear programming in the manufacturing and production industry to optimize the available resources, which allows them to gain maximum profits.
Logistics and transportation industry uses linear programming to find the shortest path/route, travel time, and pricing strategy.
Engineers apply linear programming in the energy sector. They optimize the electric load, shortest distribution lines, and also optimize the electrical power grid design.
In the agriculture sector, linear programming can be used by engineers to determine the type of crop and quantity of crop they should grow to increase revenue efficiently.
In the food industry, linear programming can help health managers and nutritionists to plan dietary needs, and low-cost food item set in order to keep away from noncommunicable disease.
Congratulations, you have made it to the end of this tutorial!
You have covered a lot of details about linear programming. You learned what linear programming is, basic concepts, and terminologies used in LP, LP-problem formulation, solving LP problems using the graphical method, and use cases of the LP problem.
Hopefully, you can now utilize the linear programming concepts to make decisions in your organization or optimize your results for decision makers. Thanks for reading this tutorial!
Check out our Graphs in Spreadsheets tutorial.
If you would like to learn more on spreadsheets, take the following DataCamp courses:
Learn more about Spreadsheets
Course
Course
Course
blog
Javier Canales Luna
16 min
podcast
Richie Cotton
71 min
tutorial
Elena Kosourova
21 min
code-along
Joe Franklin
code-along
Camilo Martinez
code-along
Nick Switzer