course
Introduction to Statistics
4 hours
69.1K
Welcome to part seven of our month-long data demystified series. As part of Data Literacy Month, this series will clarify key concepts from the world of data, answer the questions that you may be too afraid to ask and have fun along the way. If you want to start at the beginning, read our first entry in the series: What is a Dataset?
In this entry, we’ll explore one of the main use cases in data: A/B testing. While you may not have heard of it—if you’ve ever used a digital service or site—there’s a strong chance you’ve been part of an A/B test yourself. Throughout the blog post, we’ll outline what A/B tests are, how they’re generally set up, and some notable examples of A/B tests from popular services like Airbnb, Netflix, and Gojek.
A/B testing compares the performance of two versions of the same thing, often a webpage or a digital product. More broadly, A/B testing is a framework that lets you set up experiments quickly, analyze their results using statistical analysis, and make decisions based on your results.
A/B testing helps teams validate key questions such as “Does changing the color of a button increase the number of clicks?” or “Does using one movie poster or another increase the number of views for a movie title?”.
A/B testing establishes causality. If a home page with a red button drives more clicks than a blue button–all else being constant–we can conclude that the red button causes the increase in clicks. Needless to say, A/B tests are a handy tool for data-driven teams looking to optimize their product.
A/B testing works wonders, but only if the steps are followed meticulously. Here are some critical steps in designing a successful A/B test:
A hypothesis states how the change of a test variable impacts a performance metric on a population. An example of a hypothesis is the following:
“Changing the color of the add-to-cart button from blue to red (the test variable) will increase the conversion rate (the performance metric) on all desktop users (the population)”.
One common pitfall is having multiple test variables in a single experiment, making it difficult to tease out the impact of each change on the metric.
The term “A/B” in A/B testing refers to the two versions of the thing you’re testing.
Colloquially, the control is “Version A” of the product or the existing version of the test variable you’re testing. Whereas “Version B” is the treatment or the new version of the test variable you’re testing.
Using the same example of the add-to-cart button, the control (Version A) is the existing blue add-to-cart button, while the treatment (Version B) is the new red button.
Depending on the use case and the number of users a service has, it can be impossible to run an A/B test on all the population. The next best alternative is to run the A/B test on a subset or sample of users. To do this, practitioners usually determine a statistically significant sample of users that is large enough for them to make conclusions about the population.
For example, when revisiting our example of the add-to-cart button, the A/B test would be run on a fraction of desktop users instead of all desktop users.
Each user in the experiment is shown either version A or version B. How do we decide whether a user is given the control or the treatment?
To ensure that the test is fair and square, practitioners usually split the samples into the treatment and control groups randomly (as in, each user has the same probability of being in treatment or control) and equally (as in, the treatment and control groups are of the same size).
With the groundwork done, the A/B test is ready to go. Once a large enough sample is reached, the results of an A/B test can be analyzed.
To analyze the results, we calculate the difference in the test metric–conversion rate–between the treatment and control groups. If the difference is significant enough, we can confidently conclude that one version is indeed better than the other.
If a clear winner emerges from the A/B test, the superior version can now go live! Practitioners also perform a deep dive into the data to better understand users’ behavior. An A/B test is but a small part of the optimization process. Learnings extracted from running A/B tests can inspire new ideas and hypotheses whose validity can, in turn, be tested.
Most tech companies are no strangers to A/B tests. In fact, you’ve probably been in either a control or treatment group for an A/B test a service you use has been running. Here are some notable examples of A/B tests in the wild from one of the most popular sites and services today:
A few excellent examples of A/B tests come from Airbnb. Airbnb has always had a strong culture of experimentation and A/B testing. In this blog post from 2014, they deep-dive into how they tested a change of the maximum value of the price filter on the search page from $300 to $1000.
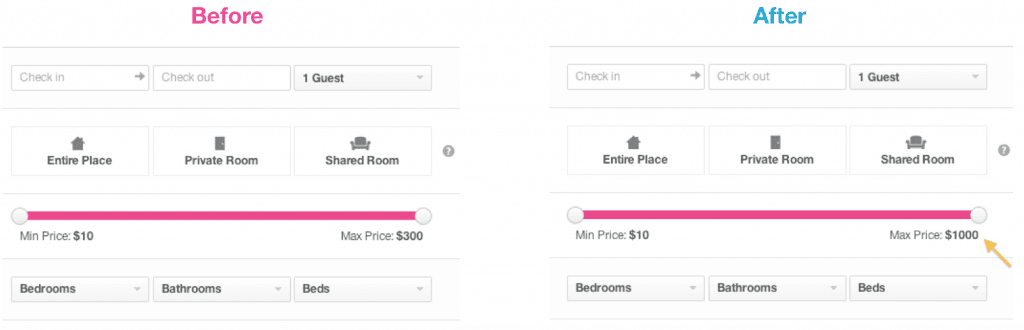
Airbnb testing changes to the maximum price filter
In another example, the team showcases an example of a redesigned homepage and discusses how it has impacted the usage of the Airbnb platform. While slightly technical, the article provides a great example of how A/B tests have been instrumental in Airbnb’s success as a product.
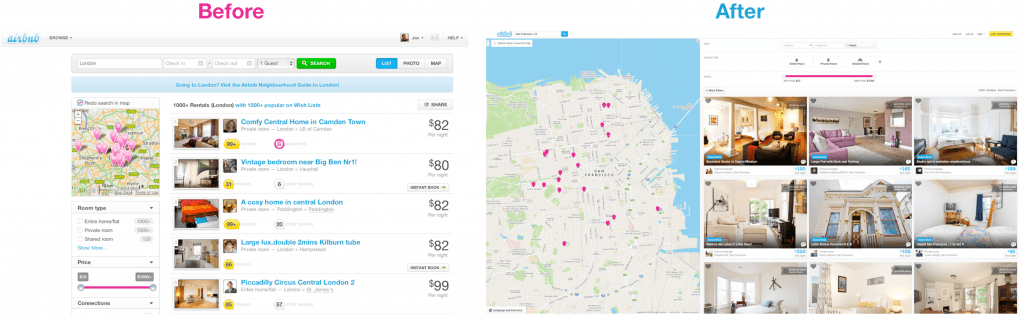
Airbnb uses A/B testing to decide on a better user interface
Through a series of A/B tests, Netflix selected the best artwork for a variety of titles and clearly increased the number of streaming hours. A nice byproduct of A/B tests is that they reveal deep insights into user behavior and user experience. For example, by running this test, Netflix determined that artwork with expressive facial emotion that conveys the tone of the title do exceptionally well.
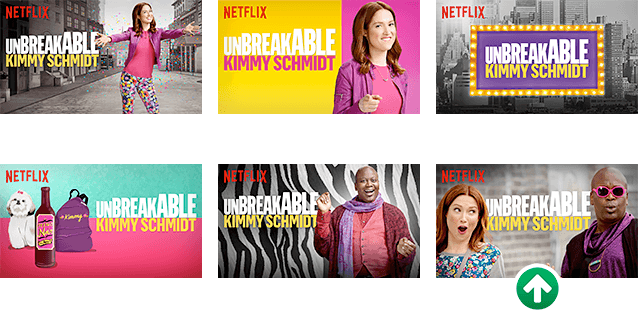
A sample of artwork for Netflix’s Unbreakable Kimmy Schmidt
Gojek, the all-in-one app ubiquitous in Indonesia, uses A/B tests to find the optimal number of products to show on its homepage. The product team then uses the feedback to decide which experiment variant is rolled out to all the users. This is one of the many A/B testing use cases found at Gojek. You can also learn more about Gojek’s data culture by listening to this episode of DataFramed.
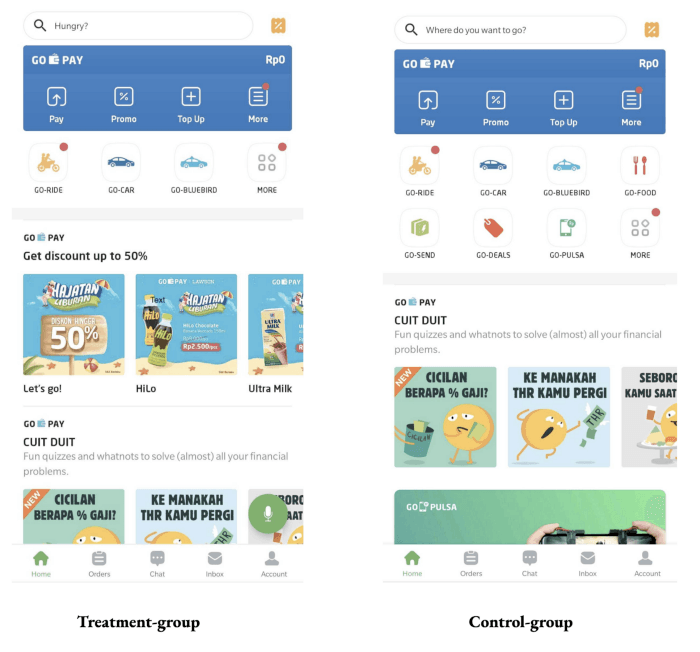
Gojek used an in-house experimentation platform to decide on their home-page design
We hope you enjoyed this short introduction to A/B testing. In the next entry of the series, we’ll be looking at the world of data visualization and break down how to interpret the most commonly used visualizations today.
If you want to get started on your data learning journey today, check out the following resources.
Data Literacy Courses
course
course
course
blog
Richie Cotton
6 min
blog
Richie Cotton
10 min
blog
Richie Cotton
5 min
blog
Richie Cotton
4 min
podcast
Richie Cotton
50 min
code-along
Arne Warnke