Good data modeling practices are very important for building Power BI reports that are optimized for performance and can scale as needed.
This tutorial uses a sample dataset provided by Microsoft but has been adapted to reflect the data modeling best practices we will discuss in this article. You can download the dataset here.
What is Data Modeling?
Data modeling is the process of creating visual representations of the connections between data structures, with information about the individual attributes contained within those data structures.
When talking about data modeling in general, the term you will hear most often is the star schema. This is a widely adopted approach to designing data warehouses and relational databases and is the recommended approach to take in Power BI as well.
There are two main benefits of using a star schema:
- Usability: A star schema makes your data model cleaner and more organized, and your report will be easier to use.
- Performance: Star schemas allow you to easily scale your report to very large volumes of data. DAX measures also calculate faster and the Power BI report refreshes faster overall.
How does a star schema work?
A star schema is made up of a central fact table with multiple dimension tables branching off of this fact table, much like the appearance of a star. Ideally, it is good practice to have only one fact table in a data model. However, it is possible to include multiple fact tables in Power BI.
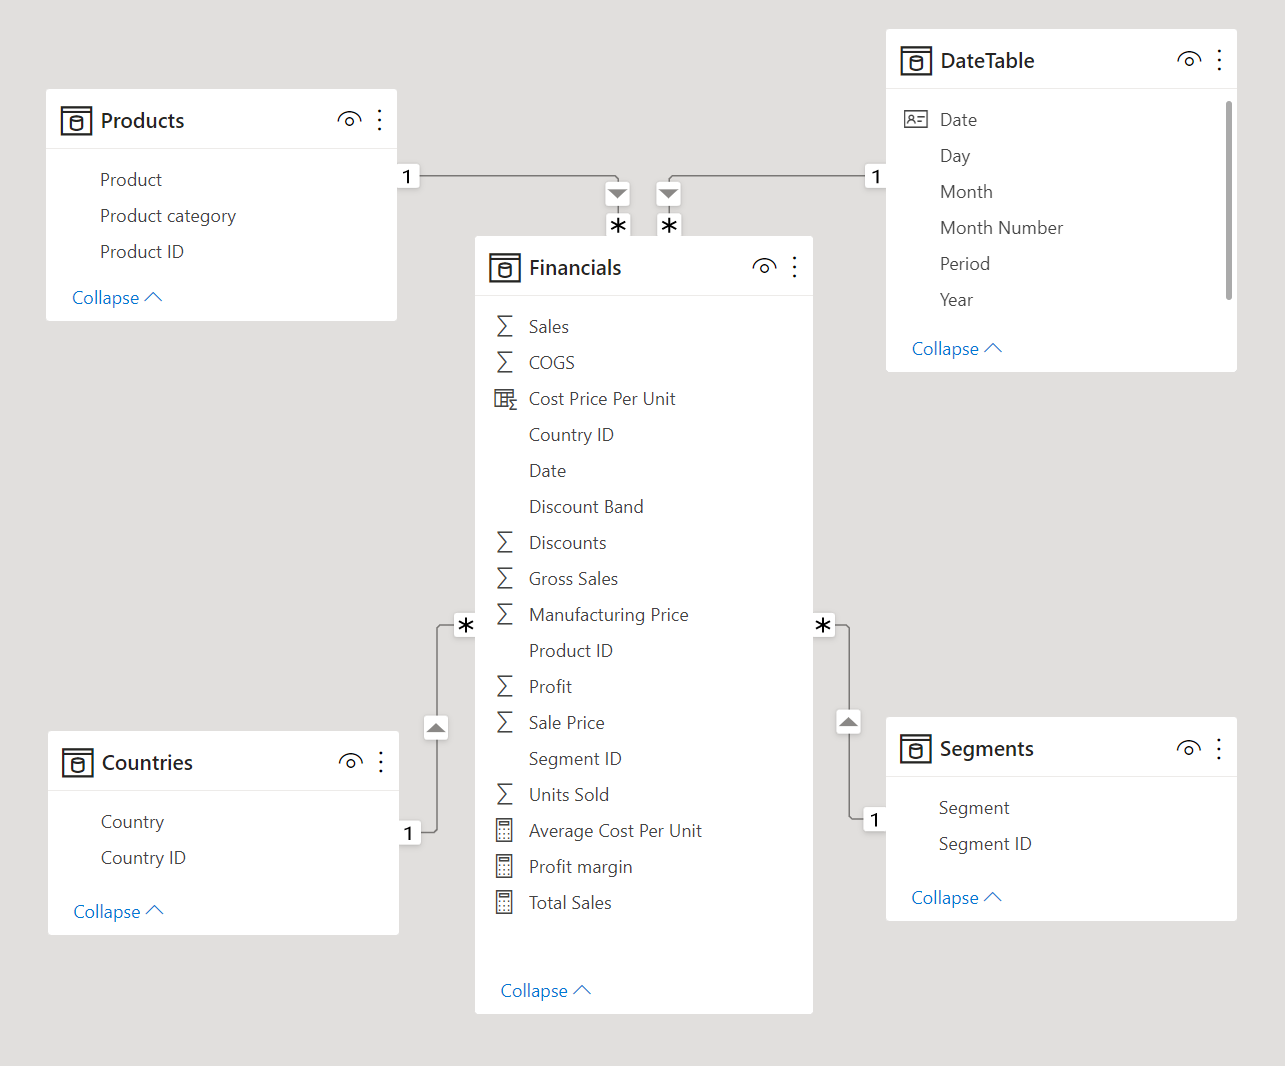 Power BI star schema. Image by Author
A fact table is made up of values that can be summarized and aggregated, as well as one or more keys that link to the dimension tables. The purpose of the key is to make connections between tables. If you have complex data models or large volumes of data, it is a good idea for the keys to be numeric values rather than text strings, as this can improve the performance of the model.
Fact tables should be very narrow and include as few columns as possible. Any columns that describe the features of a dataset, such as Product Name or Product Category, should be separated out of the fact table (if not already separated in the data warehouse) into their respective dimension tables. This process is called normalization of the data, and the goal is to avoid repetitiveness.
Dimension tables describe the features of the dataset, where features are logically grouped together in separate tables to avoid bloating a single table or making it difficult to create relationships. The dimension tables should contain unique values for the features they are describing, and their columns will be responsible for filtering or grouping the data in the Power BI report.
An extension of the star schema is the snowflake schema. In this approach, the dimension tables are further divided if a feature has any further categories or subcategories. In our case, we have a Products table that contains the Product ID, Product Name, and Product Category. In a snowflake schema, this Products table will only contain the Product ID and the Product Name, while the Product Category would be further divided out into it’s own table with a Product Category ID and Product Category.
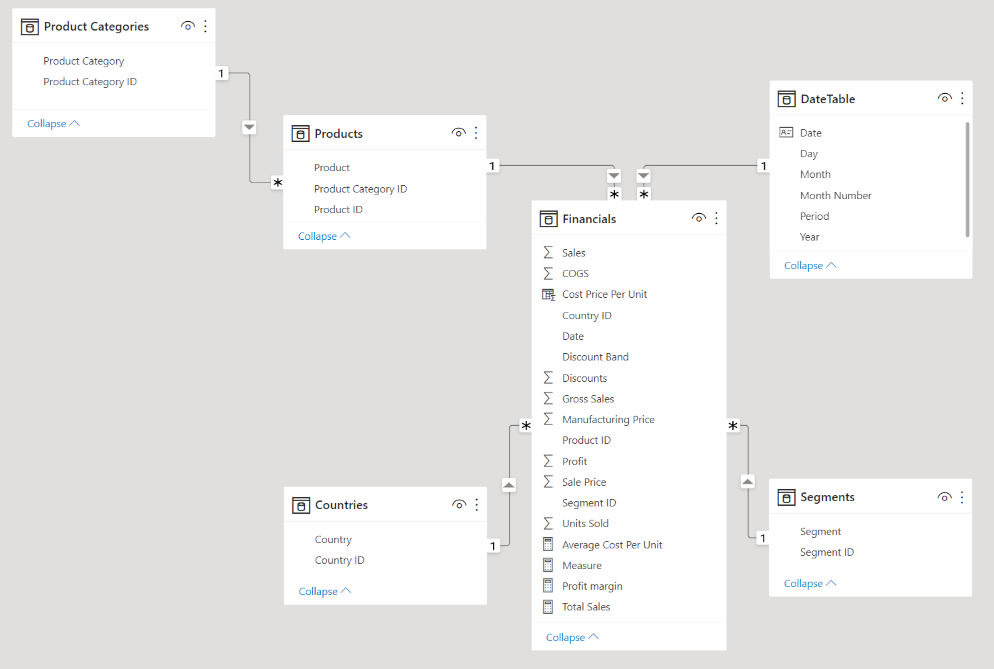 Power BI snowflake schema. Image by Author
However, using a snowflake schema can unnecessarily add to the complexity of your data model; including these extra tables could decrease performance and make creating relationships difficult and confusing.
How to Create Relationships in Power BI
There are two ways you can create a relationship in Power BI:
- Select a field from one table and drag it onto the field in the second table with which you want the relationship to form.
- Select Manage Relationships from the ribbon and select “New” to add a relationship using the same window that we will be discussing next (except that it will start as blank).
By default, Power BI will try to infer a relationship between tables; it doesn't always get this right, so you may wish to turn this feature off in the settings or delete any relationships that are created automatically. To edit the relationship, right-click the connecting line between them and select “Properties”.
This window has 2 interesting options to choose from when defining a relationship: cardinality and cross filter direction. The choices for each of these options can have a big impact on the resulting report, so choose carefully. Let's break down each of these options.
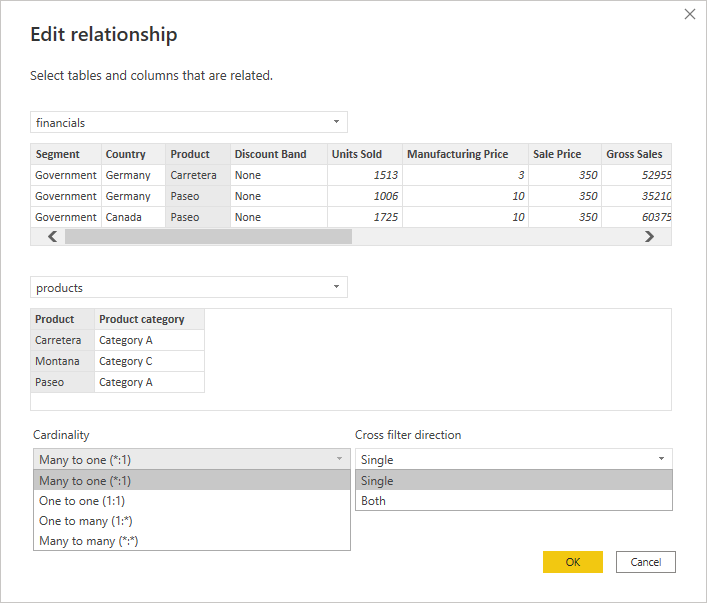 Creating relationships in Power BI. Image by Author
Cardinality
There are 4 cardinality choices: many-to-one, one-to-one, one-to-many, or many-to-many.
When creating relationships, it is recommended that the joining field contains unique values in at least 1 of the tables. This allows you to use the one-to-many or many-to-one options in your data model.
In our data, we have a relationship between the Financials table and the Products table using the Product ID field. The Products table has unique values for the Product field (each product only appears once in the table). However, the Financials table can have each product showing up several times by date, country, segment, etc.
The many-to-many option is the most problematic, and while it can be very useful in complex models, it should only be selected if you fully understand the consequences of this relationship.
To illustrate where many-to-many relationships can cause problems, we create a yearly Sales Target table by Product Category in the data model. We need to be able to report sales numbers and these targets side-by-side in the same visual. This can be achieved by creating a many-to-many relationship between the Sales Target table and the Product table.
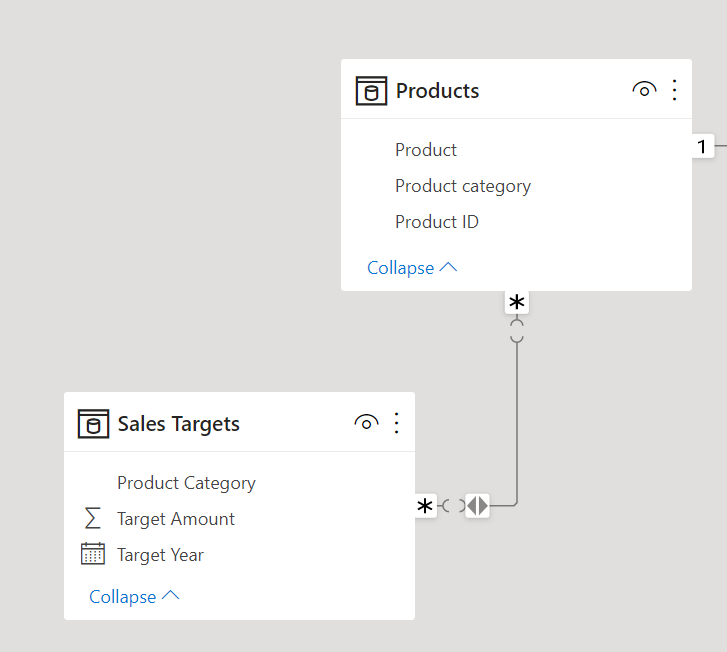 Many-to-many relationships in Power BI. Image by Author
In the following table visual, we can see our sales values and the targets side-by-side for each product category.
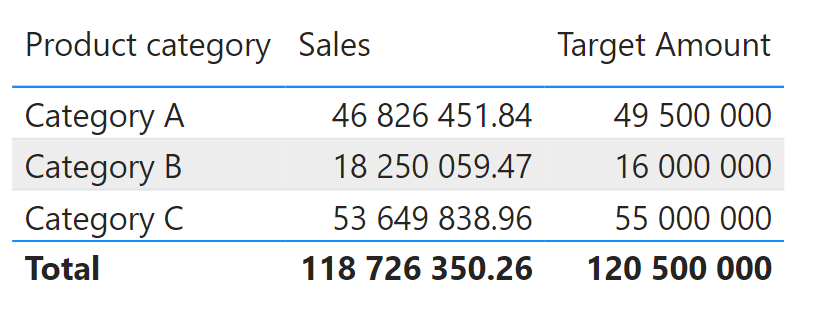
Product category, sales, and amount. Image by Author
However, if we tried to view this table at the Product level, the values for the target would be completely incorrect. This is because of differing levels of granularity in the data; since there are only sales targets at the product category level, Power BI cannot reasonably display these targets at the product level, and thus the targets are simply duplicated for each product in the product category. If you did not know that this could be a consequence of using a many-to-many relationship then this could be highly problematic for business reporting.
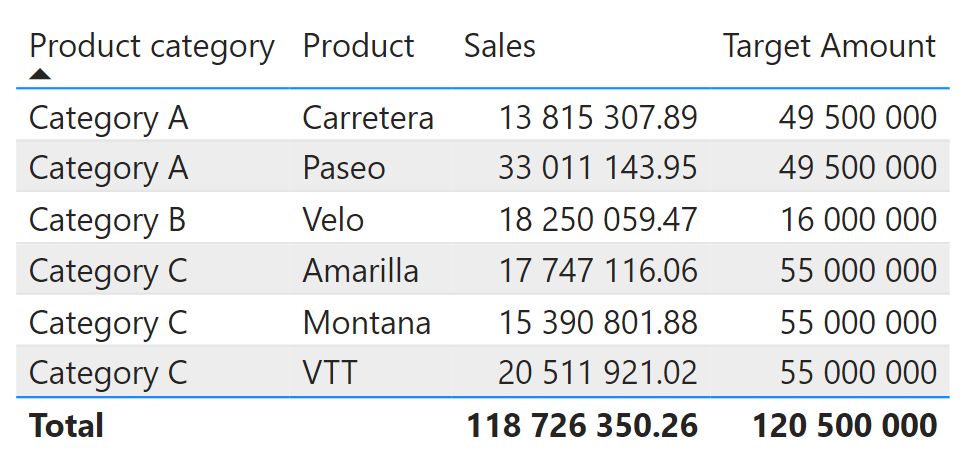 Product category, sales, and amount. Image by Author
Directionality
The cross filter direction option gives a choice between either single or both directions. Relationships flow from the table with unique values to the table with many values. In our case, the relationship flows from the Products table to the Financials table. This means that if the cross filter direction is set to single, then the Financials table can be filtered by the product and product category fields in the Products table. However, the Products table cannot be filtered by using the product ID field in the Financials table, or by using any other feature contained within other dimension tables.
The single direction is recommended for most cases. This is because bi-directional relationships (using the ‘both’ option) will not only decrease performance in the mode,l but can also introduce some ambiguity when filtering the data.
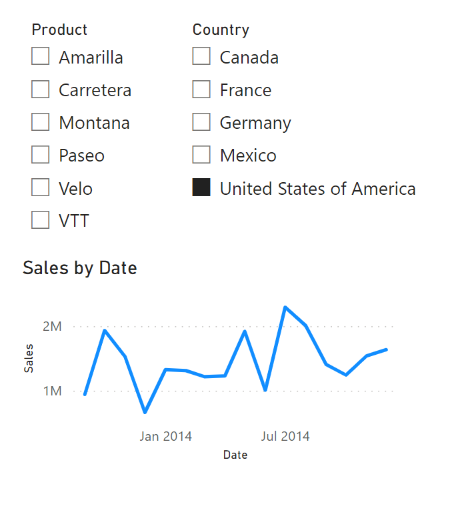
In our case, consider the relationships between the Product, Countries, and Financials tables. They are both single-direction, one-to-many relationships. This means that filtering the report by country will not also, in turn, filter the Product table. To illustrate this, consider the slicers below. Selecting a country (such as the USA) will not cause the product slicer to adjust for only the products that are relevant to that country.
Slicers in Power BI. Image by Author
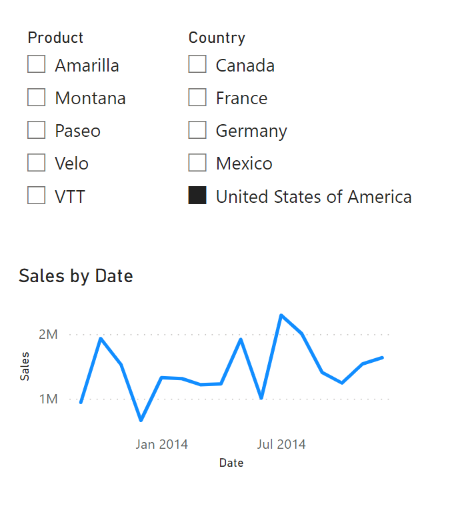
However, by changing the relationship between the Products table and the Financials table to bi-directional, we can allow the filtering to flow into the Products table. In this case, we see that the product Carretera does not show in the Product slicer because there are no sales for that product in the United States of America.
 Slicers in Power BI. Image by Author
Alternatively, to avoid using bi-directional relationships, you can add a filter to the slicer visual to exclude items that are blank. It is worth noting that you would need to do this for each visual that uses fields across dimension tables.
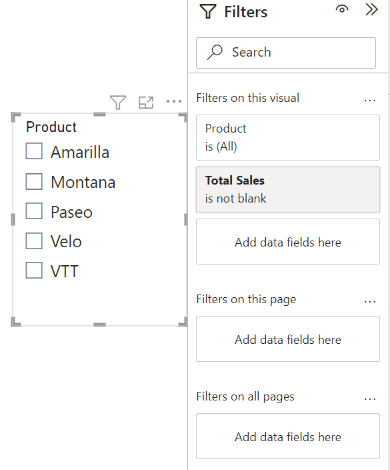 Filters and slicers in Power BI. Image by Author
How to Optimize your Power BI Model
The most important factor in optimizing your Power BI model is to use good data modeling practices such as those laid out in this tutorial. More often than not, a good data model can single-handedly allow a Power BI report to scale into the millions and billions of data rows while still maintaining a decent level of performance.
However, there are a few other things you can do to optimize your Power BI model, in addition to following good data modeling practices, such as:
- Turning off time intelligence – This feature in Power BI automatically creates date/time hierarchies each time a date field is added to a visual. Every time one of these hierarchies is created, it is essentially adding an additional table to the data model. As you can imagine, this can significantly bloat the Power BI report, slowing down the rendering of the visuals and increasing the refresh time. It is a good idea to turn this feature off and instead use a dedicated date table for all date/time hierarchies.
- Only loading the columns you actually need – Using the Power Query editor, it is a good idea to remove any columns that you do not need or are not using in your report. One of the most common fields that is usually retained just in case it’s needed, is a Row ID field. This field would be unique to your dataset, but an example is an Order ID for each transaction in an Orders table. Very often, this ID field is also stored as text which bloats the model even more. If the ID field is not explicitly used in a relationship, it’s usually not necessary to load it into your model.
- Only loading the rows you need – Don’t fall into the trap of thinking you need to import all your business data into your Power BI report. Especially if you have been in business for a long time, this can mean your report will contain a large amount of data that nobody is really paying any attention to. The key here is to talk to the business users of the report and find out exactly how much historical data they need to see. If they do need to see older data, then you could consider only importing a summarised version of that table rather than every single transaction.
Final Thoughts
Employing robust data modeling practices is crucial for building efficient and scalable Power BI reports. This tutorial emphasizes the importance of the star schema, which enhances both usability and performance. Understanding key concepts such as creating relationships, cardinality, and directionality ensures that your data model is both functional and optimized.
Additionally, adopting best practices like turning off unnecessary features and limiting data imports further enhances performance. By following these guidelines, you can significantly improve the efficiency and scalability of your Power BI reports, making them more effective tools for business analysis.
Keep building your skills by taking courses with DataCamp. Browse the full range of DataCamp Power BI resources, including courses and skill tracks, blogs, and tutorials.


blog
What are Power BI Semantic Models?

Joleen Bothma
7 min
tutorial
Power BI Tutorial for Beginners
DataCamp Team
16 min
tutorial
Data Visualization with Power BI

Parul Pandey
16 min
tutorial
Designing Engaging Power BI Reports Tutorial
Joleen Bothma
13 min
tutorial
Mastering Predictive Analytics with Power BI: A Comprehensive Guide for Data Practitioners
Joleen Bothma
12 min
code-along
Dashboard Design in Power BI

Iason Prassides