
Course
Intermediate Python
4 hr
1.1M
Let’s face the truth: the non-technical stakeholders, or the end users, have no interest in the Jupyter Notebooks or the Python scripts you create as a data practitioner. They want to be able to interact with the solution and see the results for themselves.
This is why we need to transform our work into insights reports, dashboards, or data science applications. While reports, dashboards, and web applications are common, a lesser-explored alternative is desktop applications.
Imagine being able to design an app where users can click buttons, fill out forms, and navigate through menus — all through a clear and pleasant interface on your desktop. How cool would that be?
In this tutorial, we will introduce PySide6, help you with the initial installations, and build your first desktop application. We will also explore the commonly used widgets, incorporate data visualizations from popular data science libraries, and share useful resources.
PySide6 is a toolkit that lets you create your software applications using the Python programming language with attractive and intuitive graphical interfaces.
It’s like a set of building blocks for software, allowing even those new to programming to piece together the visual and interactive elements that make up an app. With PySide6, you can turn your ideas into real, functioning applications that work on Windows, Mac, Linux, and even mobile platforms.
For the setup, we assume that you already have Python installed, and have your usual IDE with you. The installation setup is fairly straightforward.
Open your terminal and run the following, and you’ll be good.
pip3 install pyside6
Now that you have successfully installed the library, the next step is to build your first PySide6 application. This is also a way for us to test whether the setup is working fine while giving you a flavor of desktop applications.
Create a Python file named “main.py” and copy and paste the following code.
import sys
from PySide6.QtWidgets import QApplication, QLabel
app = QApplication(sys.argv)
label = QLabel('Hello, PySide6!')
label.show()
sys.exit(app.exec_())
We will understand the code in a minute, but first, run the Python file through your terminal as follows:
python3 run main.pyCongratulations, you’ve built your first desktop application! You should be seeing something like this:
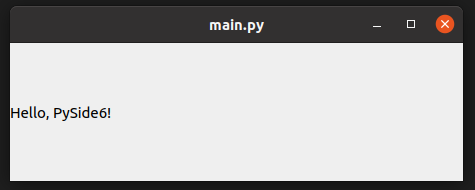
The “Hello, PySide6” desktop application (Image by author)
Let’s now break down the simple PySide6 script we saw earlier. We first import relevant modules:
import sys
from PySide6.QtWidgets import QApplication, QLabel
sys is a Python standard library module that provides access to some variables used or maintained by the Python interpreter. In the context of a PySide6 application, it's commonly used for command-line arguments. Check out our command line argument parsing tutorial to learn more.QApplication and QLabel are imported from PySide6.QtWidgets. QApplication is the core application management class in PySide6, necessary for any GUI application. QLabel is a widget that displays text, which we use to show a simple message.Next, we create an instance of QApplication.
app = QApplication(sys.argv)
This is required in every PySide6 application. sys.argv is used to pass command-line arguments to the application. Even if you don't use command-line arguments, sys.argv is still required, as it initializes the QApplication with some defaults.
label = QLabel('Hello, PySide6!')Next, we create a QLabel widget with the text "Hello, PySide6!". This is the text that will be displayed in our application window.
label.show()This line makes the label visible. By default, widgets in PySide6 are not visible until you explicitly show them.
sys.exit(app.exec_())Finally, this line starts the event loop of the application. The exec_() method of QApplication enters the main loop of the application, where all events (like mouse clicks and keyboard presses) are processed. The sys.exit() call ensures a clean exit when the application is closed. The event loop runs until the QApplication instance receives an exit signal, such as closing the window.
As we saw in the output earlier, our script creates a basic GUI application with a single-window displaying the text “Hello, PySide6!”.
Widgets in the context of PySide6 and GUIs are the basic building blocks used to create a user interface in a software application. Think of widgets as various elements you see and interact with in any software application — like buttons, text boxes, labels, sliders, and drop-down menus.
In the first PySide6 application, we saw a label widget that was used to display text. When building a GUI with PySide6, we’re essentially arranging these widgets in a window in a way that makes sense for our application. Each widget serves a specific purpose and interacts with the user differently.
The comprehensive list of widgets, and their usage can be found in the official documentation, but the most commonly used ones are:
Let us create an application that uses these common widgets and displays them:
import sys
from PySide6.QtWidgets import QApplication, QMainWindow, QLabel, QPushButton, QLineEdit, QComboBox, QCheckBox, QRadioButton, QTextEdit, QSlider, QSpinBox, QProgressBar, QTableWidget, QTableWidgetItem, QVBoxLayout, QHBoxLayout, QWidget

class DemoWindow(QMainWindow):
   def __init__(self):
       super().__init__()

       # Main Widget and Layout
       main_widget = QWidget()
       self.setCentralWidget(main_widget)
       main_layout = QVBoxLayout(main_widget)

       # Function to add widget with label
       def add_widget_with_label(layout, widget, label_text):
           hbox = QHBoxLayout()
           label = QLabel(label_text)
           hbox.addWidget(label)
           hbox.addWidget(widget)
           layout.addLayout(hbox)

       # QLabel
       self.label = QLabel('Hello PySide6!')
       add_widget_with_label(main_layout, self.label, 'QLabel:')

       # QPushButton
       self.button = QPushButton('Click Me')
       self.button.clicked.connect(self.on_button_clicked)
       add_widget_with_label(main_layout, self.button, 'QPushButton:')

       # QLineEdit
       self.line_edit = QLineEdit()
       add_widget_with_label(main_layout, self.line_edit, 'QLineEdit:')

       # QComboBox
       self.combo_box = QComboBox()
       self.combo_box.addItems(['Option 1', 'Option 2', 'Option 3'])
       add_widget_with_label(main_layout, self.combo_box, 'QComboBox:')

       # QCheckBox
       self.check_box = QCheckBox('Check Me')
       add_widget_with_label(main_layout, self.check_box, 'QCheckBox:')

       # QRadioButton
       self.radio_button = QRadioButton('Radio Button')
       add_widget_with_label(main_layout, self.radio_button, 'QRadioButton:')

       # QTextEdit
       self.text_edit = QTextEdit()
       add_widget_with_label(main_layout, self.text_edit, 'QTextEdit:')

       # QSlider
       self.slider = QSlider()
       add_widget_with_label(main_layout, self.slider, 'QSlider:')

       # QSpinBox
       self.spin_box = QSpinBox()
       add_widget_with_label(main_layout, self.spin_box, 'QSpinBox:')

       # QProgressBar
       self.progress_bar = QProgressBar()
       add_widget_with_label(main_layout, self.progress_bar, 'QProgressBar:')

       # QTableWidget
       self.table_widget = QTableWidget(5, 3)
       for i in range(5):
           for j in range(3):
               item = QTableWidgetItem(f"Cell {i+1},{j+1}")
               self.table_widget.setItem(i, j, item)
       add_widget_with_label(main_layout, self.table_widget, 'QTableWidget:')

   def on_button_clicked(self):
       self.label.setText('Button Clicked!')

# Run the application
app = QApplication(sys.argv)
window = DemoWindow()
window.show()
sys.exit(app.exec_())
The output is as follows:
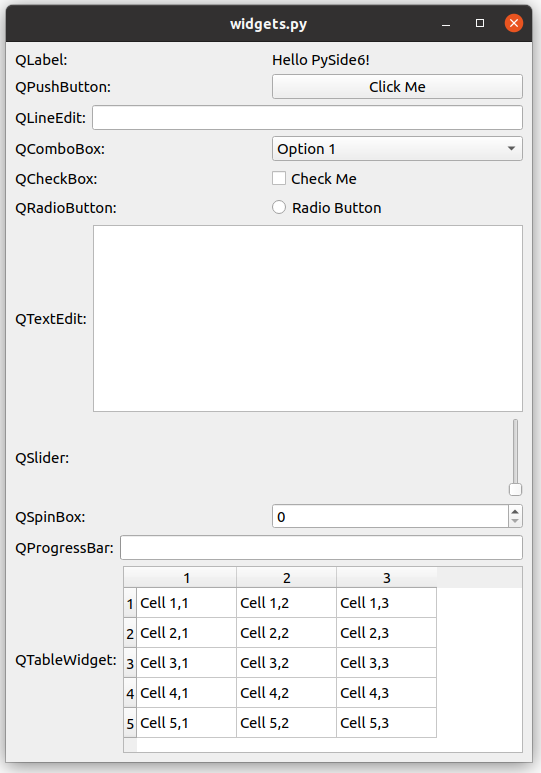
The widgets desktop application (Image by author)
We have successfully created a desktop application that incorporates the most common widgets. For ease of understanding, we have added labels for each of the widgets alongside it. Though this is a sample application, we can now pick and use one of these popular widgets for our more complex applications.
To create this application, we shall first pick a popular dataset and create standalone visualizations. This step resembles the day-to-day exploratory data analysis we do in data science work. Then we shall wrap these visualizations into a desktop application, just like how we can transform our reports and analysis to an interactive desktop application.
Before starting, let’s ensure we have all required libraries by running the following command on the terminal.
pip3 install matplotlib seabornHere, we load the popular “iris dataset” natively available in the Python visualization package — Seaborn. We use the same package, along with Matplotlib, to create the visualizations. For a comprehensive understanding of plotting with Seaborn, you may want to check out our Python Seaborn visualization guide.
import seaborn as sns
import matplotlib.pyplot as plt
# Load the Iris dataset
iris = sns.load_dataset("iris")
Then, we create visualizations as follows:
plt.figure(figsize=(6, 4))
sns.scatterplot(data=iris, x="sepal_length", y="sepal_width", hue="species")
plt.title("Sepal Length vs Sepal Width")
plt.show()
The first visualization we can see is a scatter plot of sepal length vs. sepal width, colored by species.
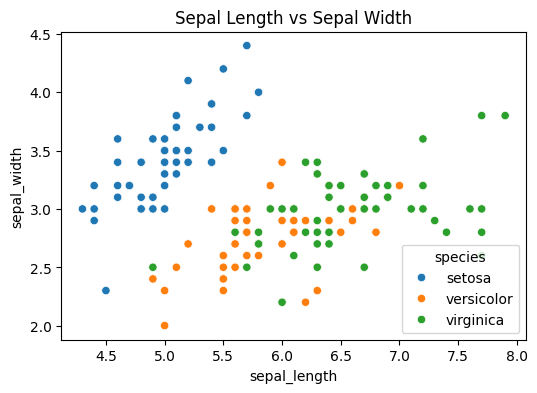
Visualization #1: Sepal length vs. sepal width (Image by author)
The second visualization is a histogram of petal length, colored by species.
plt.figure(figsize=(6, 4))
sns.histplot(iris, x="petal_length", hue="species", kde=True)
plt.title("Histogram of Petal Length")
plt.show()
And we see the output as:
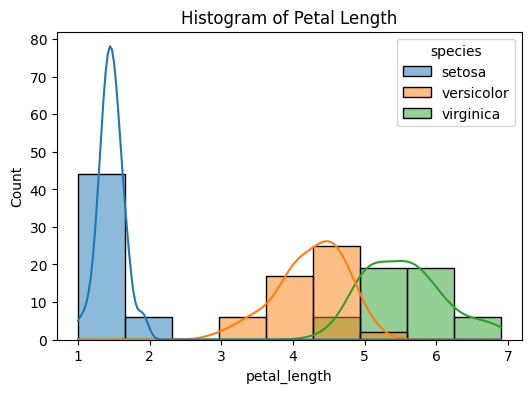
Visualization #2: Histogram of petal length (Image by author)
Finally, let’s plot a box plot showing the distribution of petal width across different species.
plt.figure(figsize=(6, 4))
sns.boxplot(x="species", y="petal_width", data=iris)
plt.title("Box Plot of Petal Width")
plt.show()
The visualization is as follows:
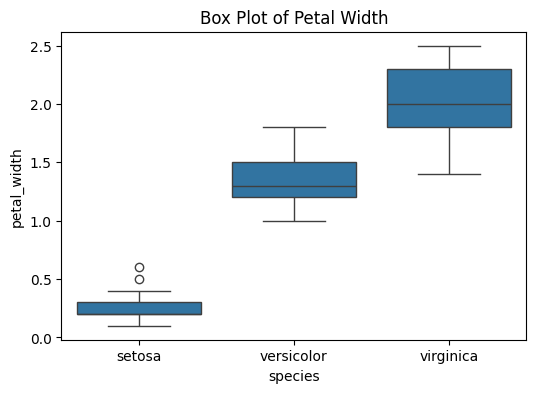
These plots provide different insights into the Iris dataset, showcasing the relationships and distributions of various features across iris species.
First, let us see the code, and understand it.
import sys
import seaborn as sns
from PySide6.QtWidgets import QApplication, QMainWindow, QVBoxLayout, QWidget
from matplotlib.backends.backend_qt5agg import FigureCanvasQTAgg as FigureCanvas
from matplotlib.figure import Figure

class IrisVisualizer(QMainWindow):
   def __init__(self):
       super().__init__()
       self.setWindowTitle("Iris Dataset Visualizations")
       self.setGeometry(100, 100, 1200, 900)  # x, y, width, height
       self.initUI()

   def initUI(self):
       central_widget = QWidget(self)
       self.setCentralWidget(central_widget)
       layout = QVBoxLayout(central_widget)

       # Adding multiple plots
       self.addScatterPlot(layout)
       self.addHistogram(layout)
       self.addBoxPlot(layout)

   def addPlotCanvas(self, layout, plot_func):
       canvas = FigureCanvas(Figure(figsize=(6, 4)))
       plot_func(canvas.figure)
       layout.addWidget(canvas)

   def addScatterPlot(self, layout):
       def scatter_plot(figure):
           iris = sns.load_dataset("iris")
           ax = figure.add_subplot(111)
           sns.scatterplot(data=iris, x="sepal_length", y="sepal_width", hue="species", ax=ax)
           ax.set_title("Sepal Length vs Sepal Width")

       self.addPlotCanvas(layout, scatter_plot)

   def addHistogram(self, layout):
       def histogram(figure):
           iris = sns.load_dataset("iris")
           ax = figure.add_subplot(111)
           sns.histplot(iris, x="petal_length", hue="species", kde=True, ax=ax)
           ax.set_title("Histogram of Petal Length")

       self.addPlotCanvas(layout, histogram)

   def addBoxPlot(self, layout):
       def box_plot(figure):
           iris = sns.load_dataset("iris")
           ax = figure.add_subplot(111)
           sns.boxplot(x="species", y="petal_width", data=iris, ax=ax)
           ax.set_title("Box Plot of Petal Width")

       self.addPlotCanvas(layout, box_plot)

# Run the application
app = QApplication(sys.argv)
window = IrisVisualizer()
window.show()
sys.exit(app.exec_())
We structure the application around the IrisVisualizer class, which extends PySide6's QMainWindow. This class sets up the main window and its layout, acting as a container for our visualizations. Each plot is embedded into the GUI using FigureCanvasQTAgg from Matplotlib, which allows Matplotlib figures to be displayed as PySide6 widgets.
The key to our integration lies in the addPlotCanvas method. This method creates a Matplotlib figure, renders a plot on it, and then embeds this figure into the application's layout. Specific methods like addScatterPlot, addHistogram, and addBoxPlot define the individual plots, which were our standalone plots earlier. The layout of the main window is set to a vertical box layout (QVBoxLayout), which stacks all the plots vertically.
Let us see our final application:
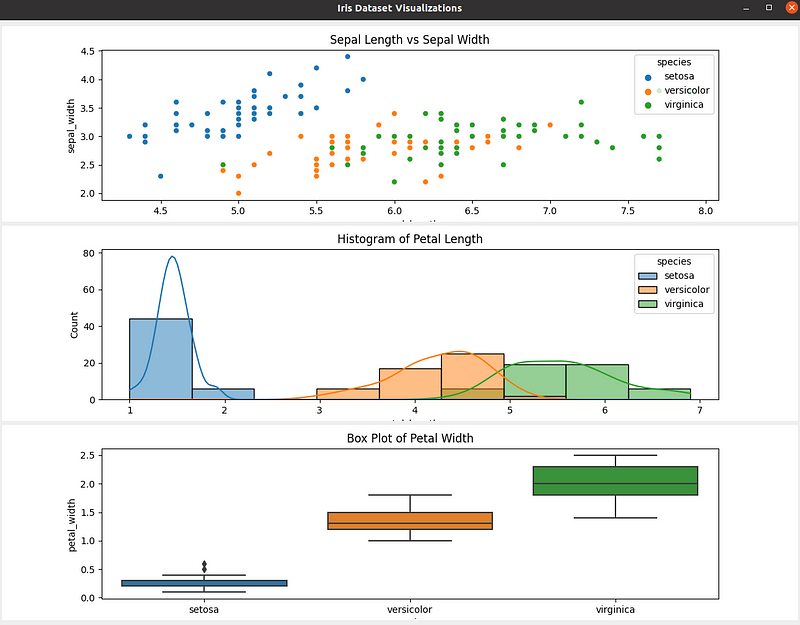
Iris dataset visualizations desktop application (Image by author)
Isn’t this application better than a plot in the Jupyter Notebook? Of course, this is a simple example, but once we understand the concepts behind creating these applications, we improve them into a fully-fledged data insights dashboard or a data science application.
This tutorial introduced PySide6, a Python library that enables data practitioners to create GUI desktop applications using the most familiar language — Python. We started with installing PySide6 and creating our first desktop application.
We further expanded it to cover the most common widgets used in desktop applications.
Finally, we understood how to incorporate visualizations from popular libraries such as Seaborn and Matplotlib directly into our PySide6 applications.
For further learning, we encourage you to refer to the official documentation and follow your curiosity to create any of your favorite applications. Alternatively, you may also have a look at our tutorial which creates GUI desktop applications in Python but using an alternate library, Tkinter.
Start Your Python Journey Today!
Course
Course
Course
cheat sheet
Richie Cotton
tutorial
Adel Nehme
tutorial
Bex Tuychiev
11 min
tutorial
Bex Tuychiev
11 min
tutorial
Javier Canales Luna
6 min
code-along
Blenda Guedes