track
Tableau Fundamentals
23hrs hours
Tableau Prep Builder is a data preparation tool designed to help users prepare the data by cleaning, shaping, and combining data for analysis in Tableau. It was first introduced in 2018 and rebranded from Tableau Prep to Tableau Prep Builder in 2019. As a no-code data engineering tool, seamlessly integrated with one of the leading data visualization tools, it's appealing for people seeking to automate tedious ETL tasks.
This tutorial covers the fundamentals of Tableau Prep Builder, from installing the application to navigating the platform and building data flows.
Tableau Prep Builder is relatively intuitive to navigate. However, there are a couple of things to know before getting started.
After entering your information, you'll see the following screen appear:
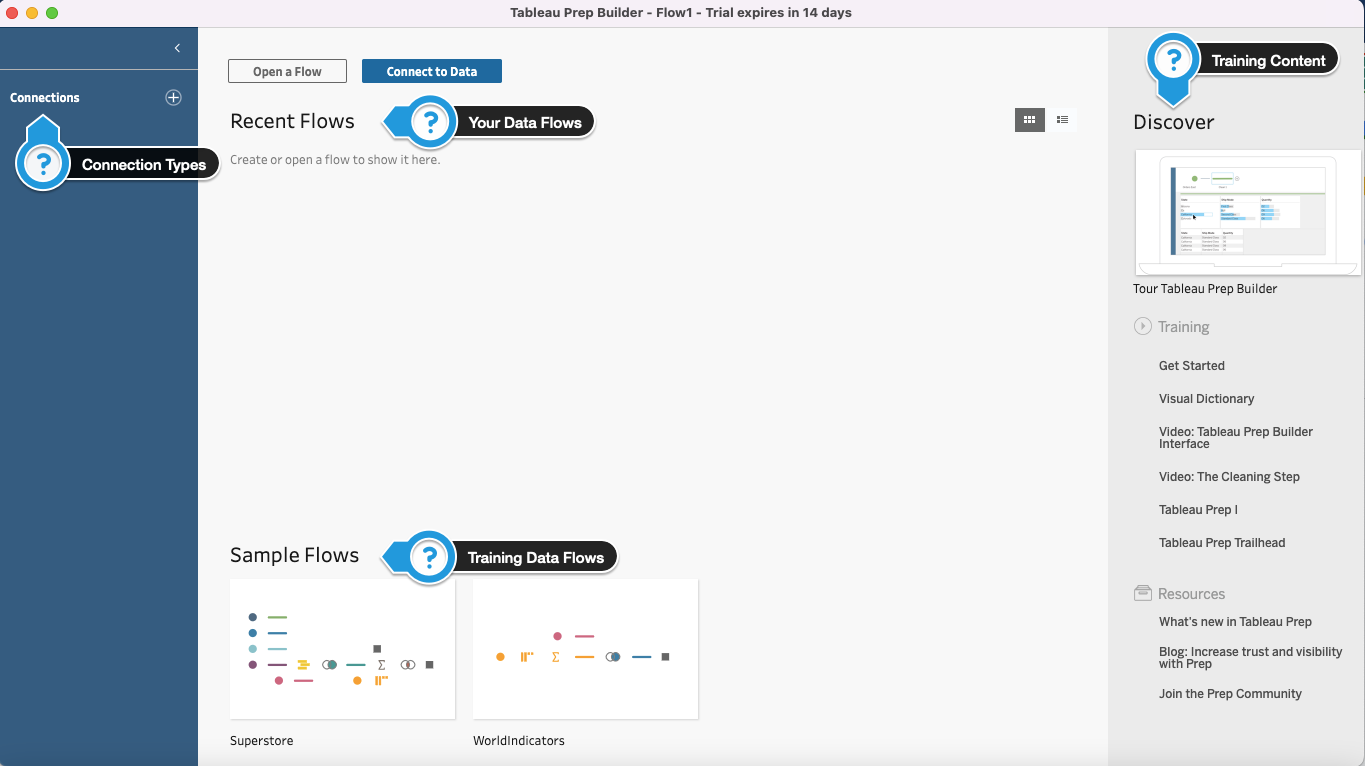
From left to right,
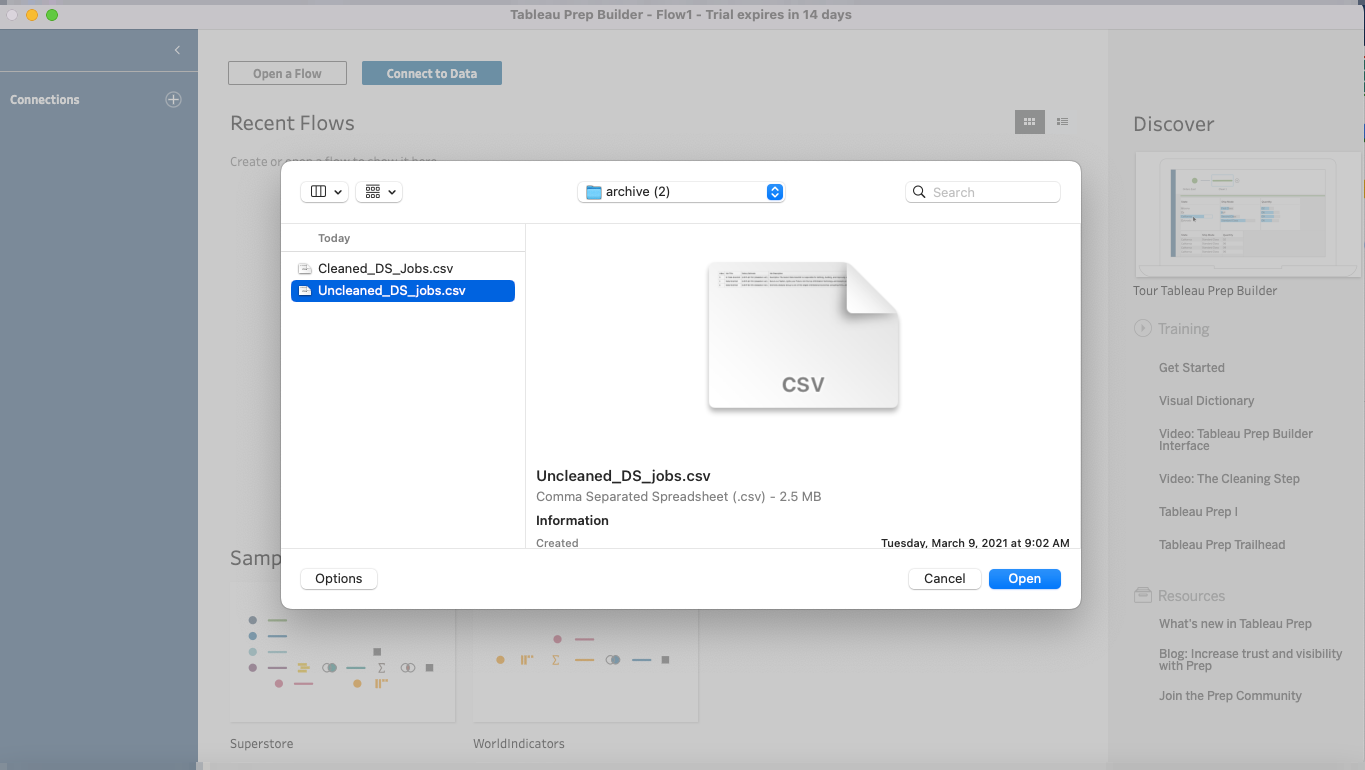
First, let's pick our dataset. I've chosen Data Science Job Posting on Glassdoor, available on Kaggle Two csv files come in the .zip file, one containing dirty/messy data, the other being the cleaned-up version of the messy dataset.
Click on the + icon next to Connections > To a File > Text File (your connection type may be different depending on the type of data you're working with). You can also go through the same steps by selecting Connect to Data at the top of the screen. Once the dataset is selected, click Open.
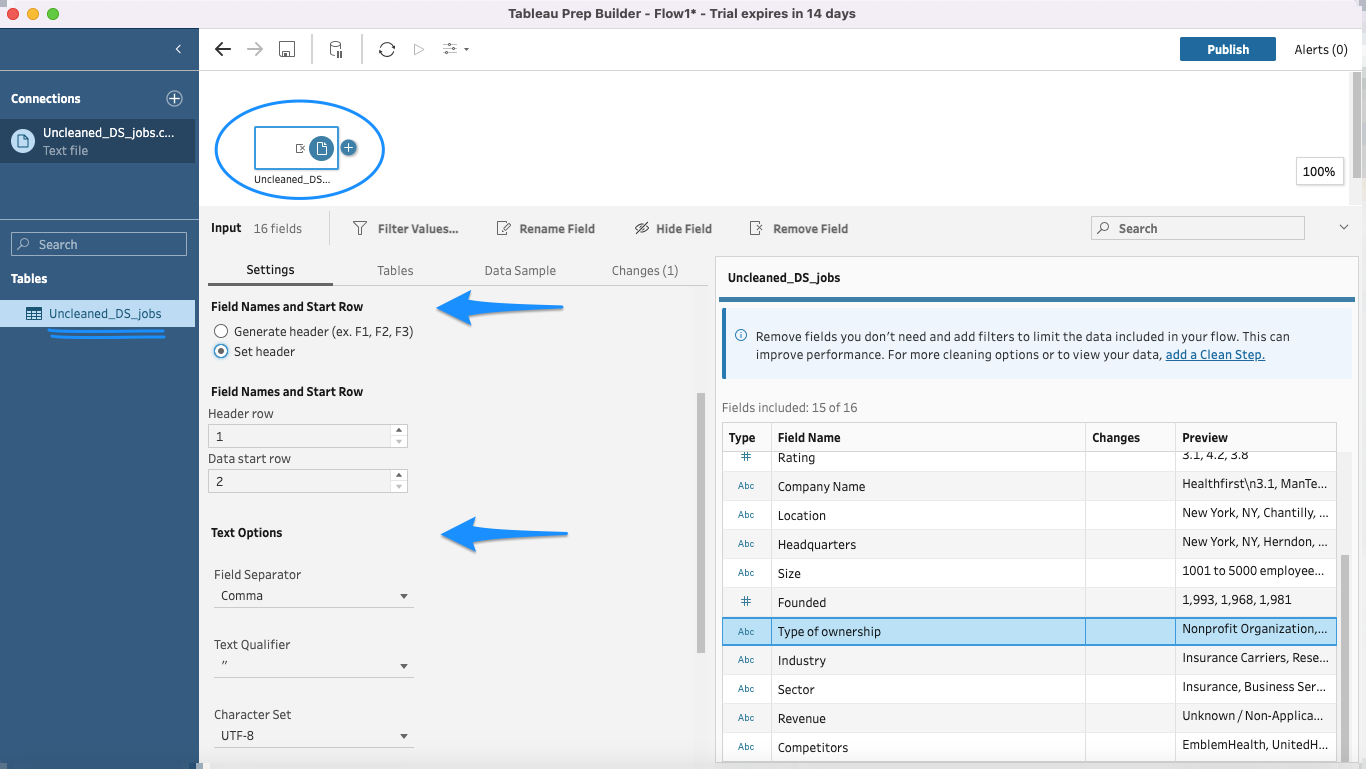
The table is now available to use. Click on the table on the left pane and update the file parameter settings so Tableau correctly interprets your file.
In my case, I chose to set the header so the first row of the file would be interpreted as the column headers, and data values would be populated starting from the second row. I also specified the field separator to comma-delimited and the text qualifier to double quotes.
Tableau Prep typically streamlines the data preparation process for analysis. This is done by automatically inferring data structure upon import. Tableau Prep Builder detects various data types (e.g., dates, numeric values, strings) and relationships between data fields.
This is also helpful when loading data from multiple sources that have the same data types for further data blending, like unions and joins.
We're now ready to manipulate our data! Let's set up our first data flow.
Let's go through common data flows in Tableau Prep Builder to transform our messy dataset.
After opening the dataset, the second step is to clean it. To do so, click on the + icon next to the dataset in the top workspace and select Clean Step. In this step, you have several options to clean up your data: change data types, group similar values together, split column values, etc.
While there are a number of cleaning steps we could perform on the DS Job Posting dataset, we'll focus our efforts on removing negative values from the Founded column.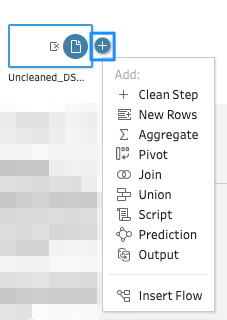
If you look carefully at the Founded column, you’ll notice some negative values.
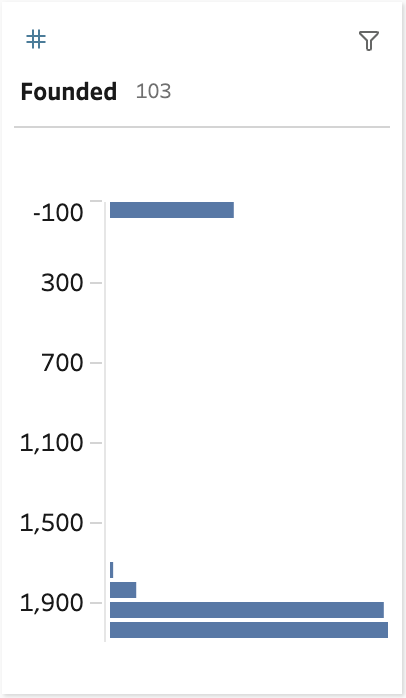
This shouldn’t be possible, as we are expecting only years that should contain non-negative values.
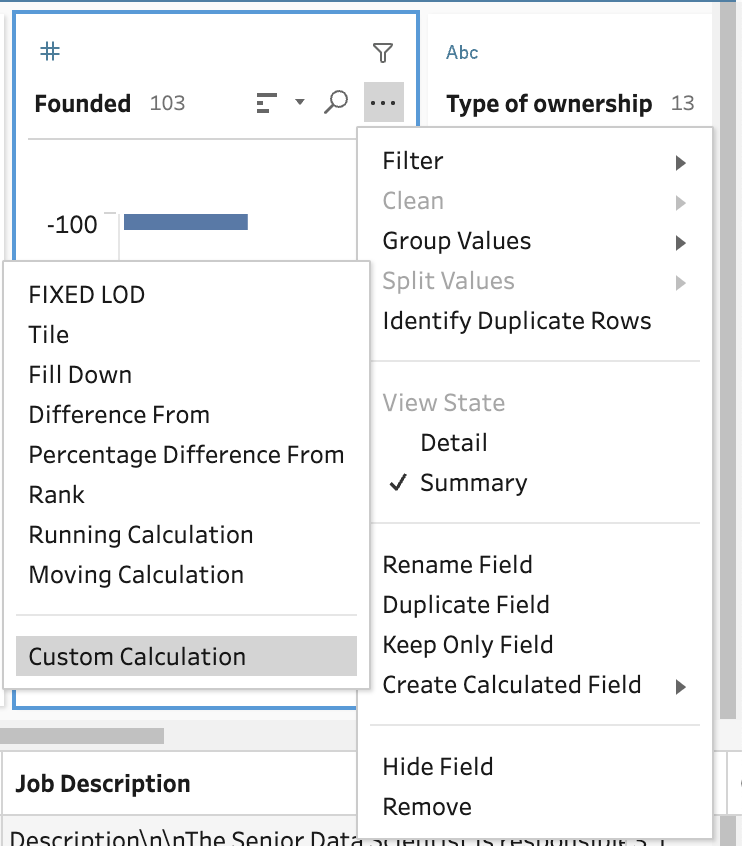
To replace all the negative values with null values, you’ll have to use a calculated field.
To create one, select the “...” button in the Founded column, followed by Create Calculated Field, and then Custom Calculation.
In the window that appears, give your calculated field a name like “Replace Negative With Nulls.”
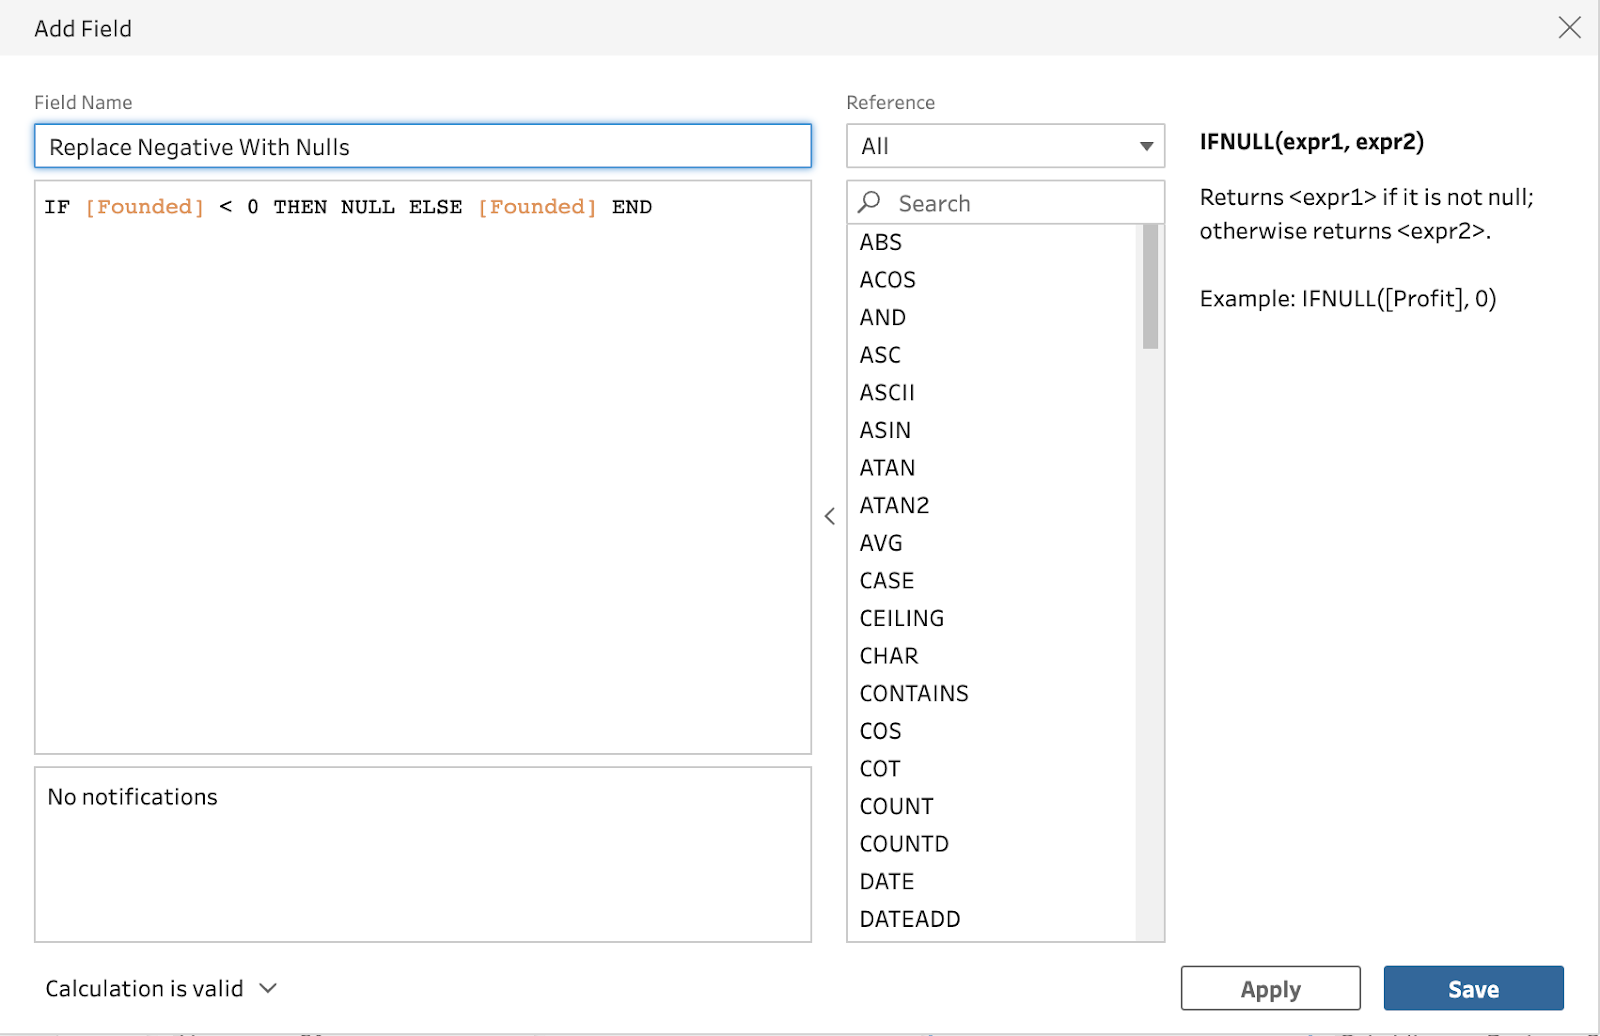
In the main box, enter an appropriate find and replace function like the one below:
IF [Founded] < 0 THEN NULL ELSE [Founded] END
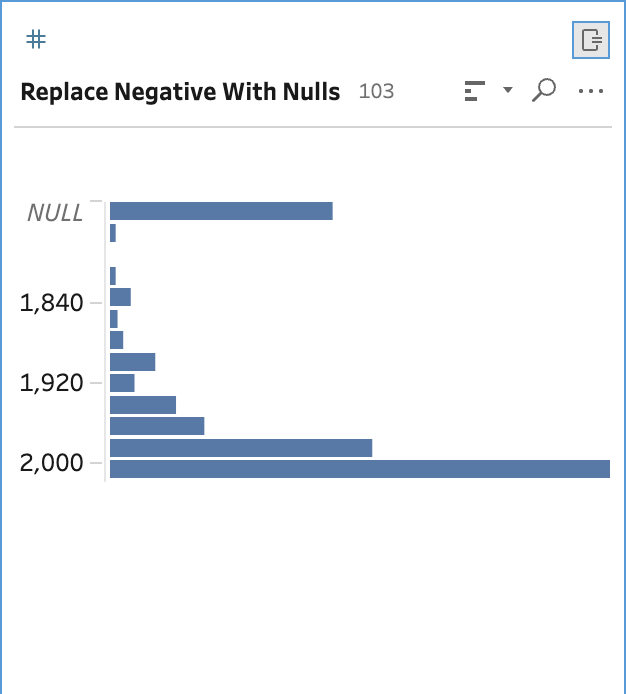
Go ahead and click on Save once you’re ready. This should clean out all negative values found within the Founded column.
Here’s what the cleaned column should look like:
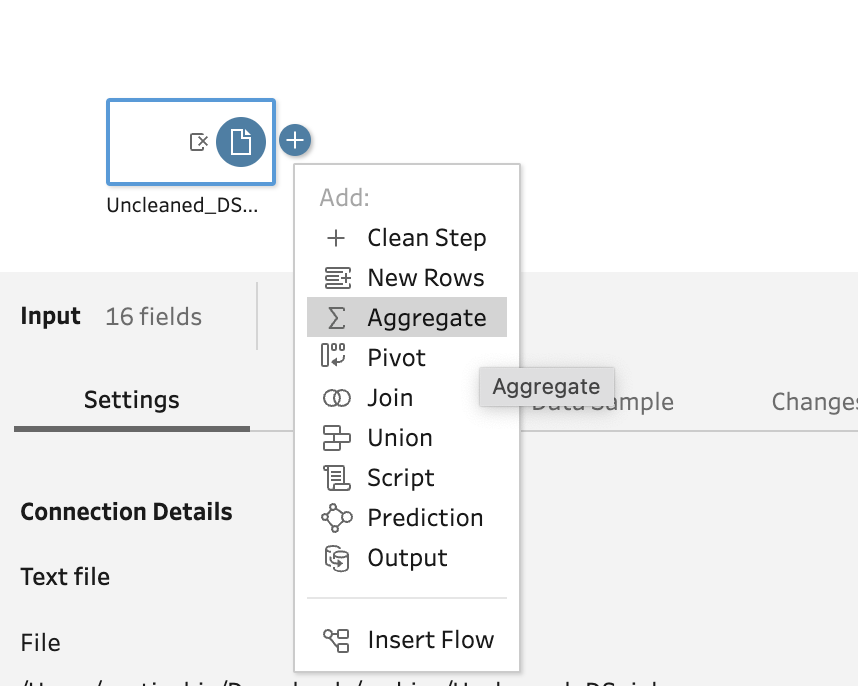
Next, let’s also explore the Aggregate function available on Tableau Prep. Aggregating data allows you to adjust to the level of detail of your data table. This makes it easier for you to combine data from multiple tables together that have the same level of detail.
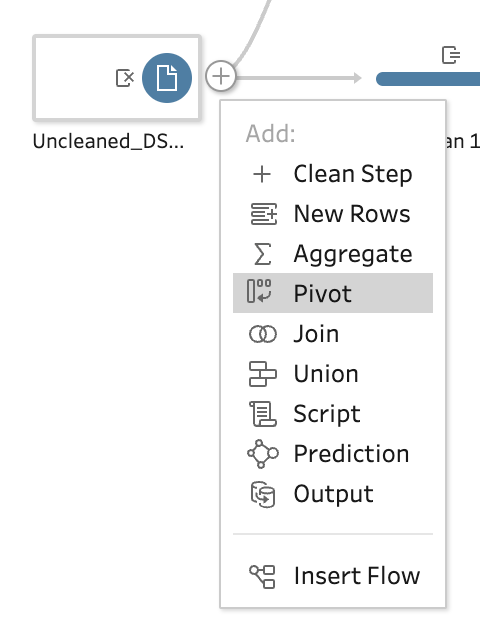
To get started, select the “+” button near the data and select Aggregate.
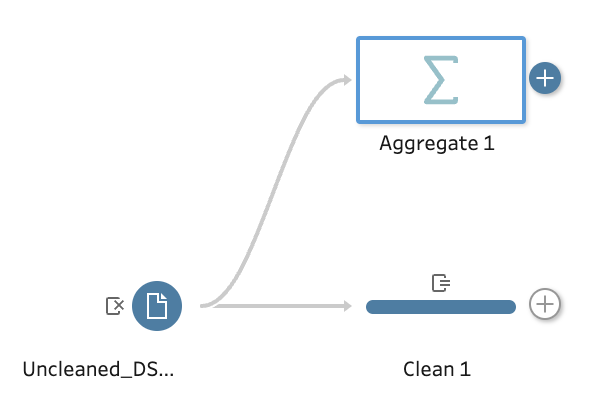
A new Aggregate step should be added to your workflow canvas. This is what it looks like.
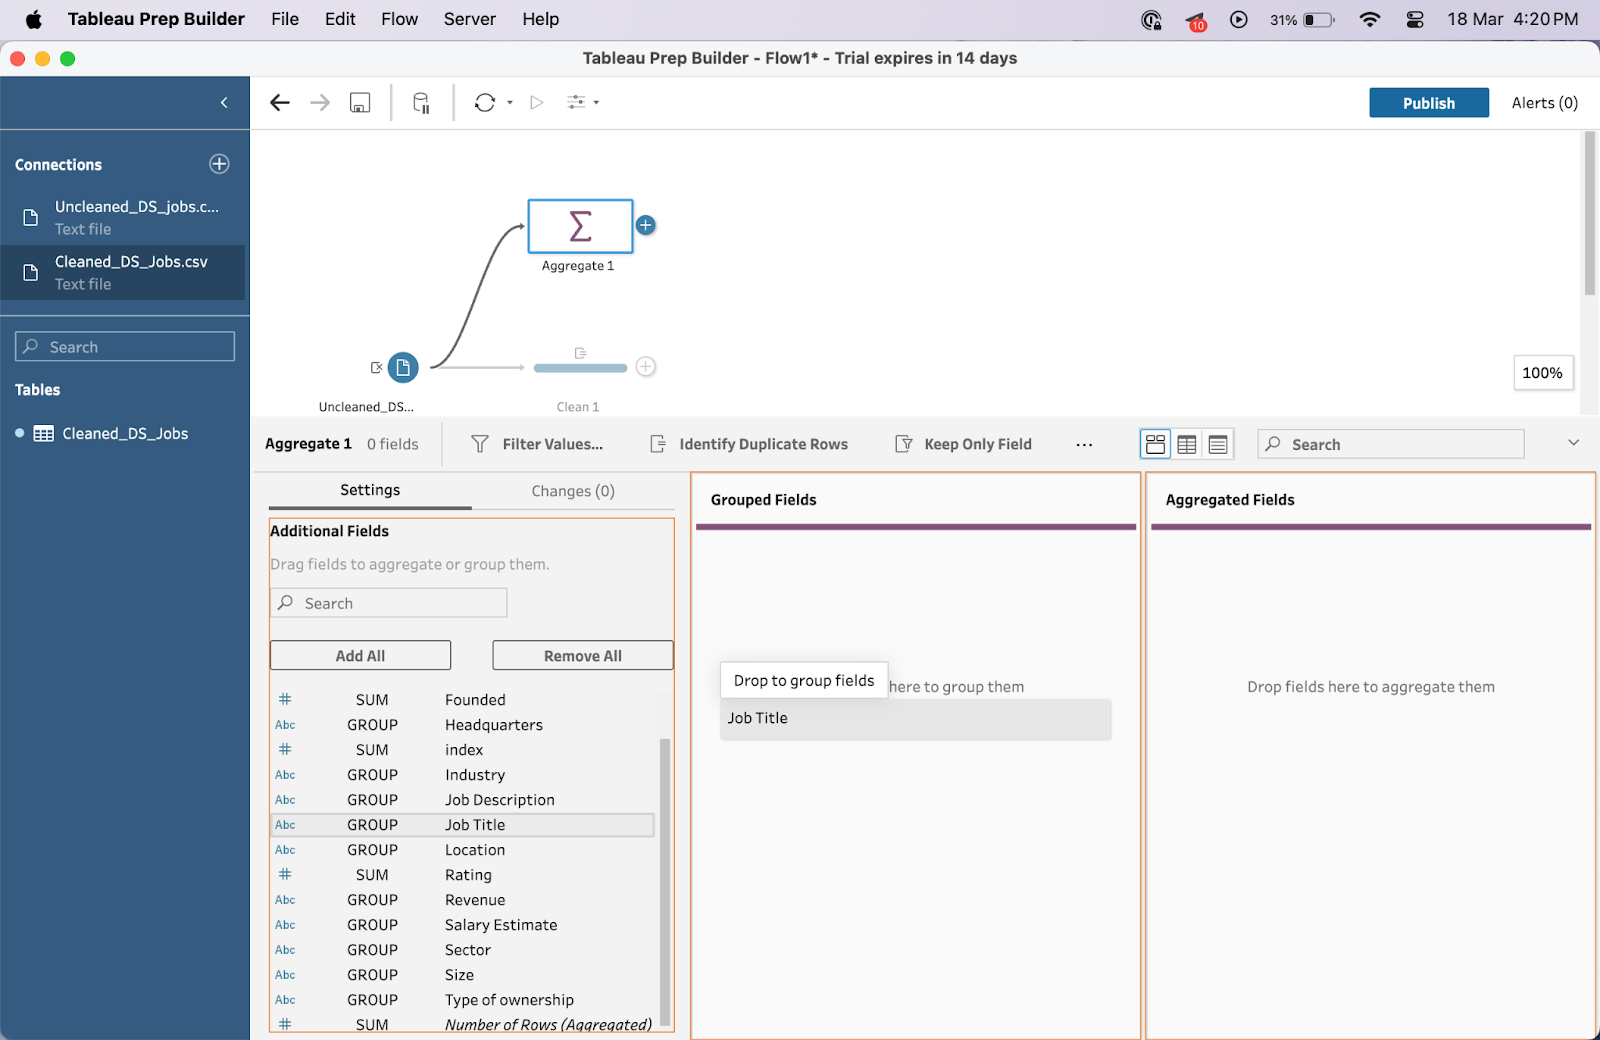
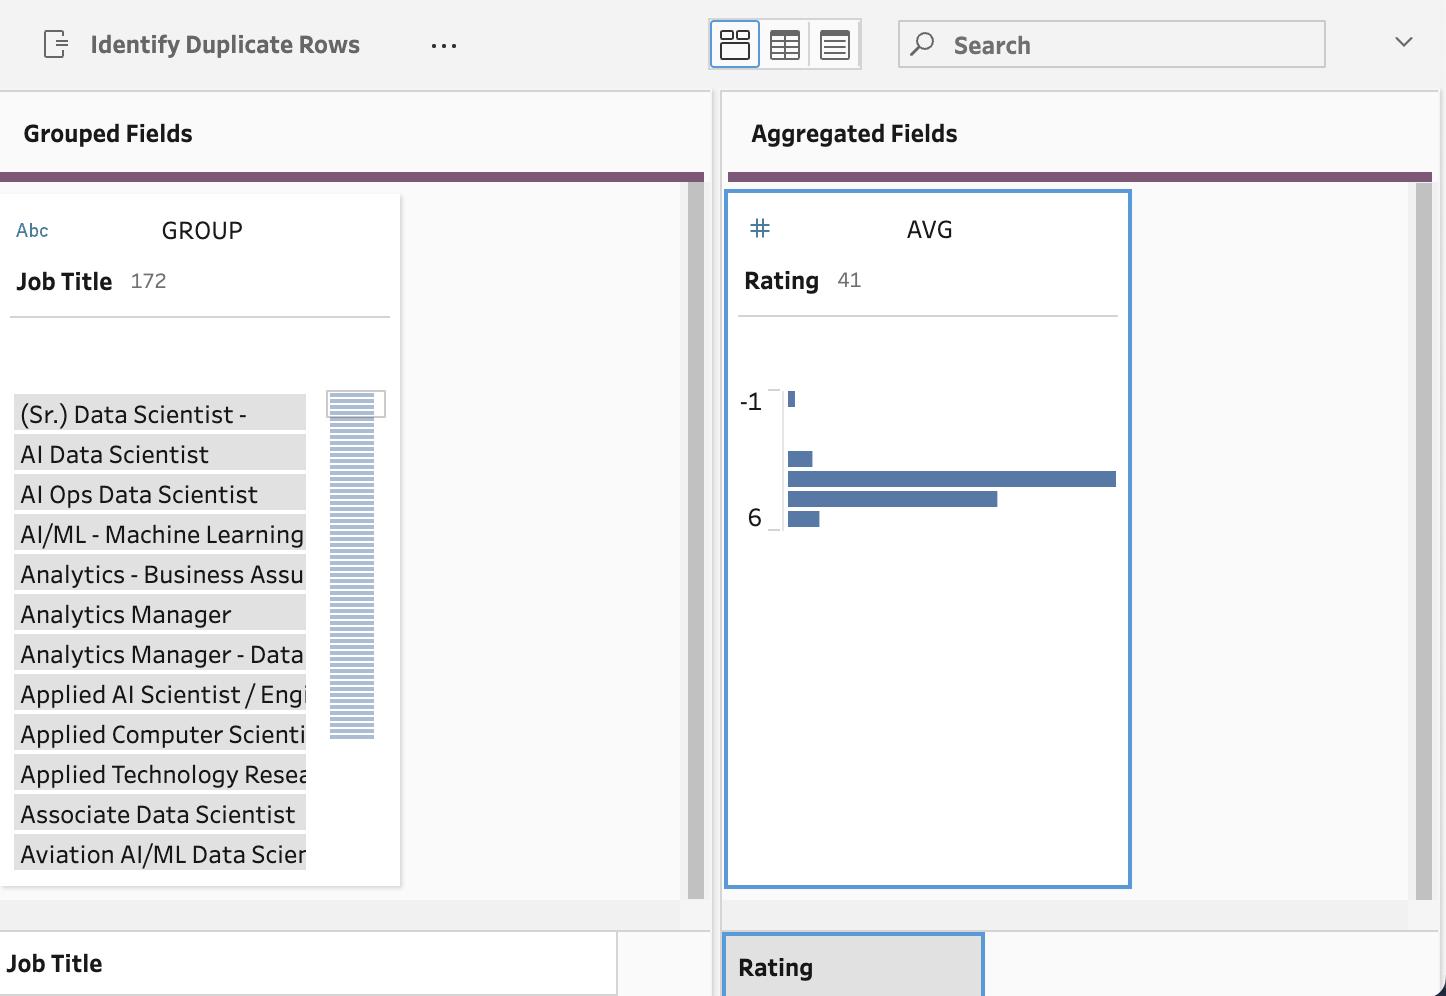
In this next step, we’ll take a look at how our data can be grouped by Job Title with the average of job ratings.
To create the aggregate, simply drag and drop any additional fields on the left pane onto the fields on the right.
In this example, we will drag the “Job Title” field onto the Grouped Fields panel. This is because we intend to group the data according to job title.
Next, we should add the “Rating” field from the left pane onto the Aggregated Fields panel on the right.
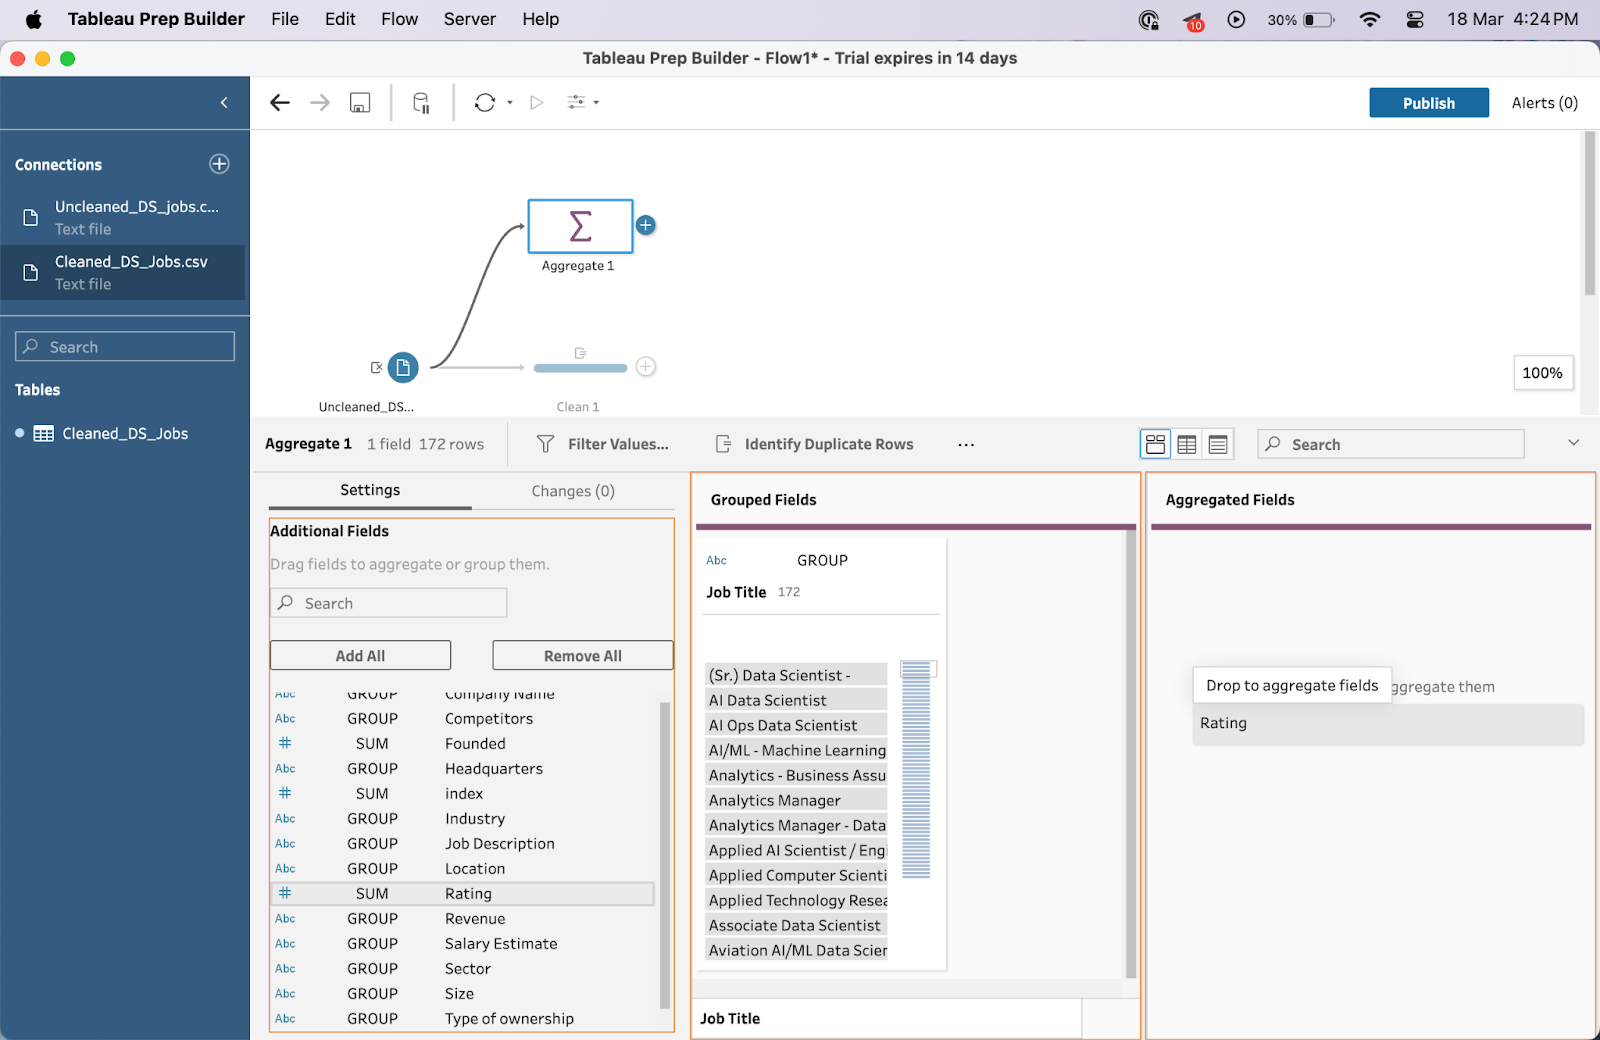
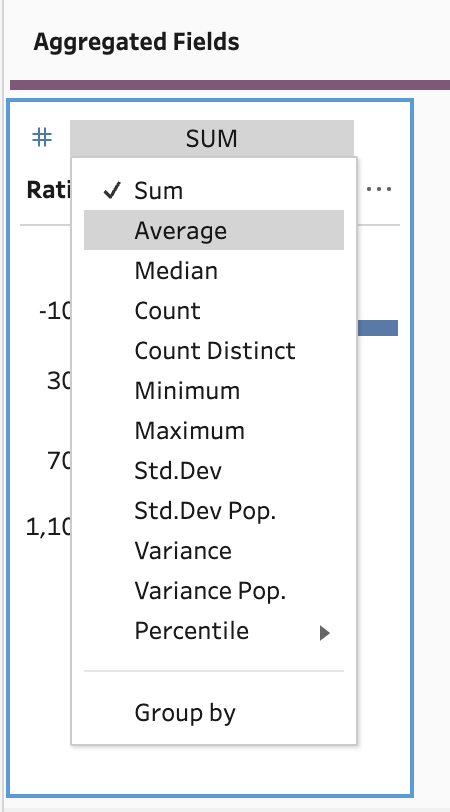
Once the ratings data appears, make sure to change from sum to average to have a more appropriate aggregation method.
Select the SUM button near the Ratings fields and select Average instead.
Your result should look something like this:
Next, let's talk about a key feature of Tableau Prep, the Pivot function. This function is great for reshaping your data based on the visualizations you’d like to create later on.
You can shape short, wide data tables into long, narrow data tables and vice versa. This makes the data more appropriate for different types of charts and graphs.
To start making a pivot, select the “+” button near your data table and then select Pivot.
Some new panes should appear below your main workflow interface.
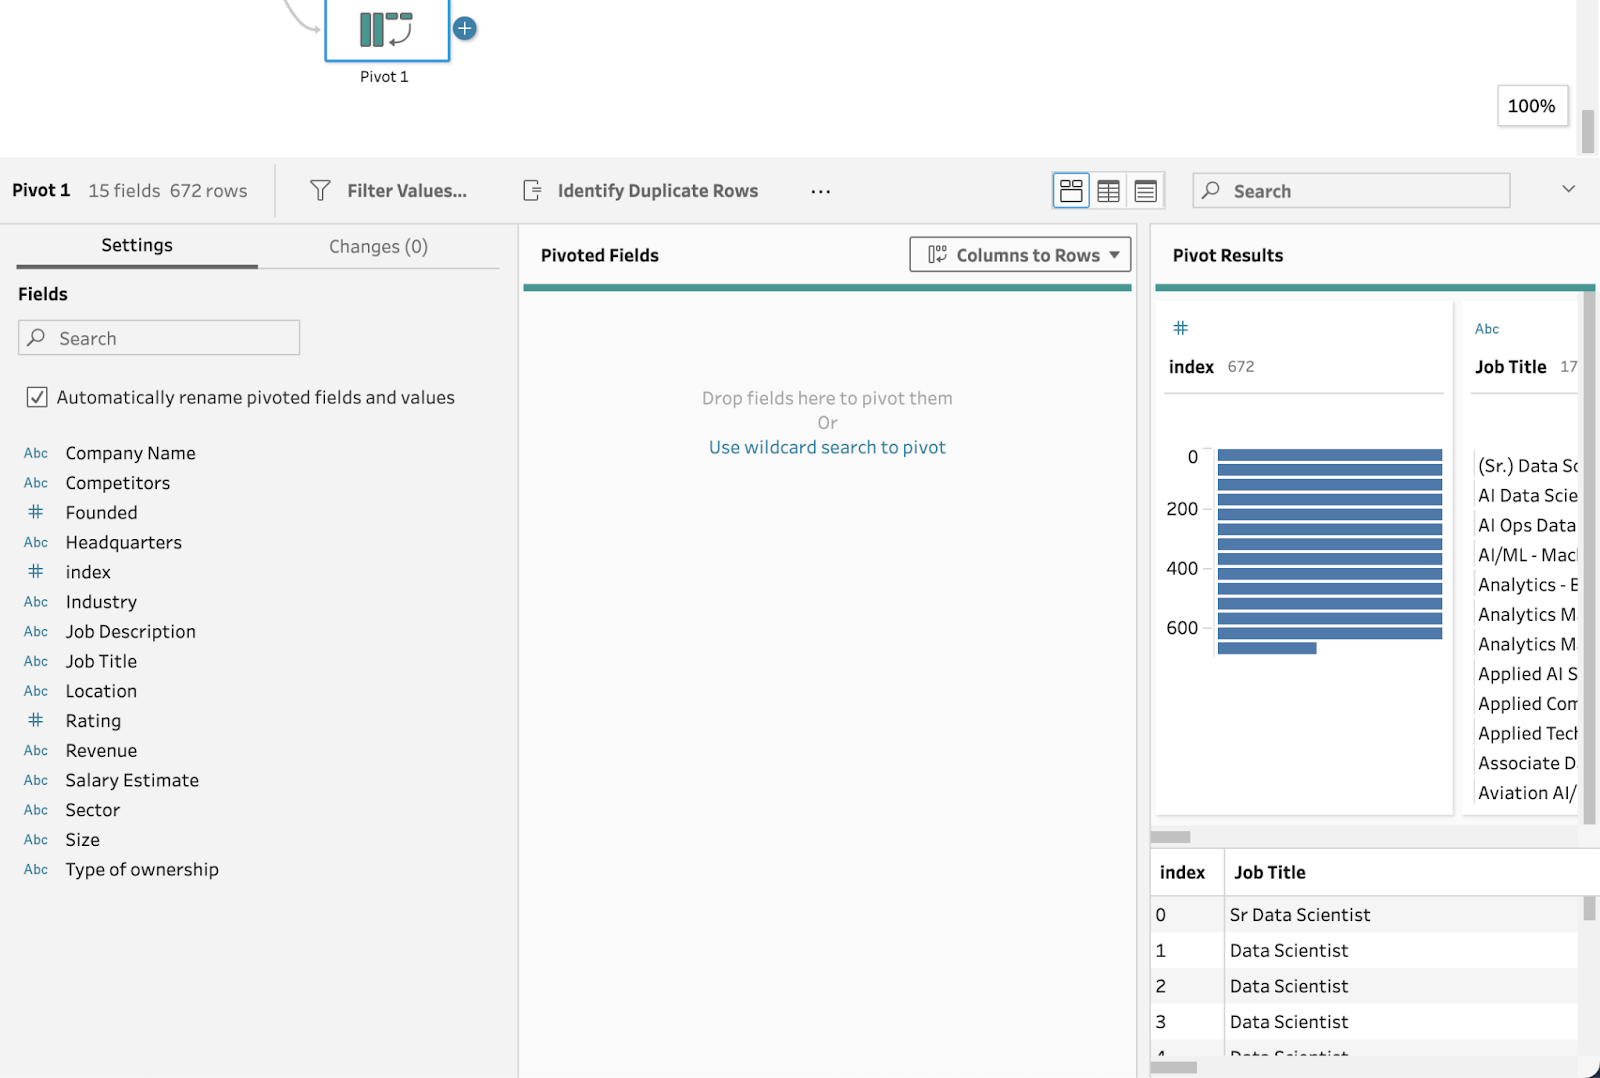
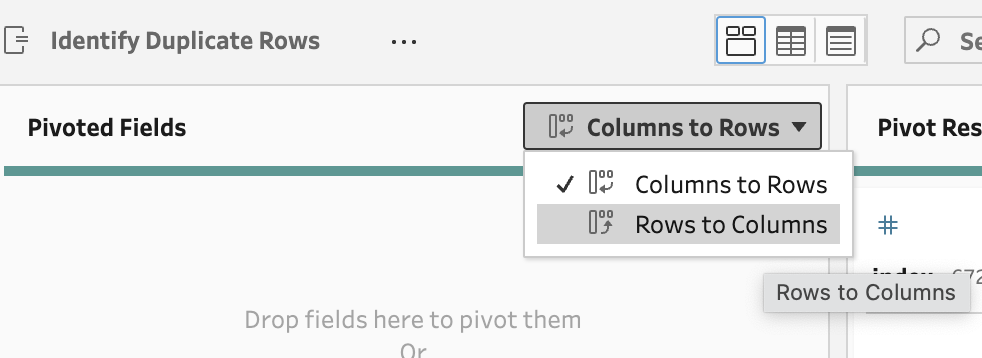
Next, select Columns to Rows and switch to the Rows to Columns button.
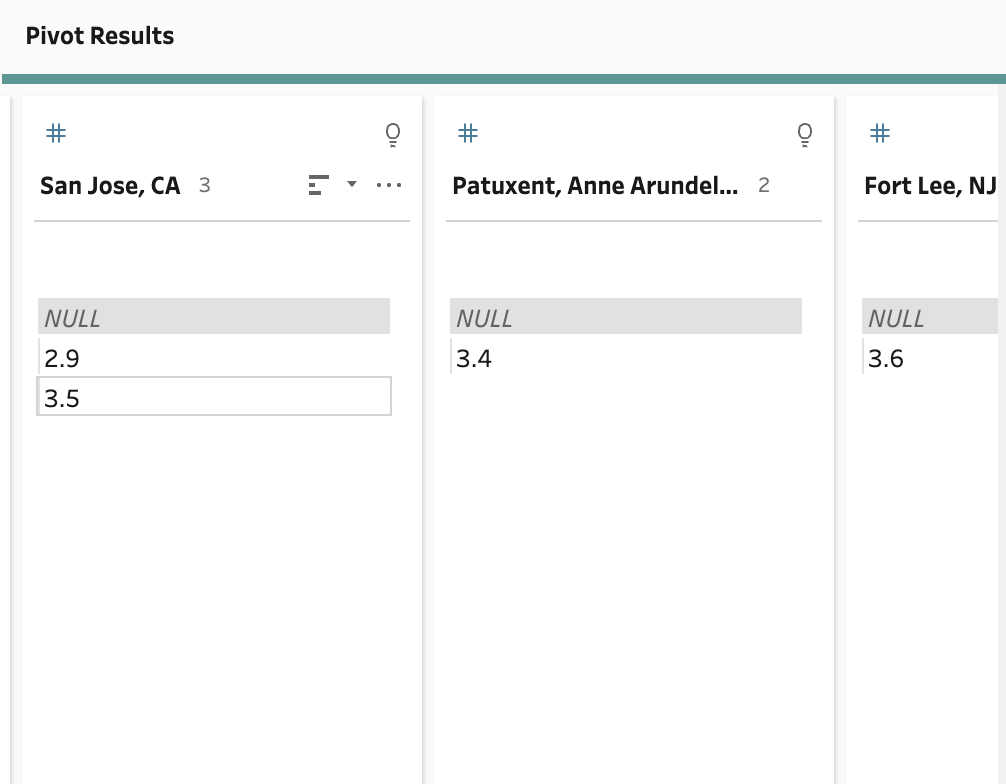
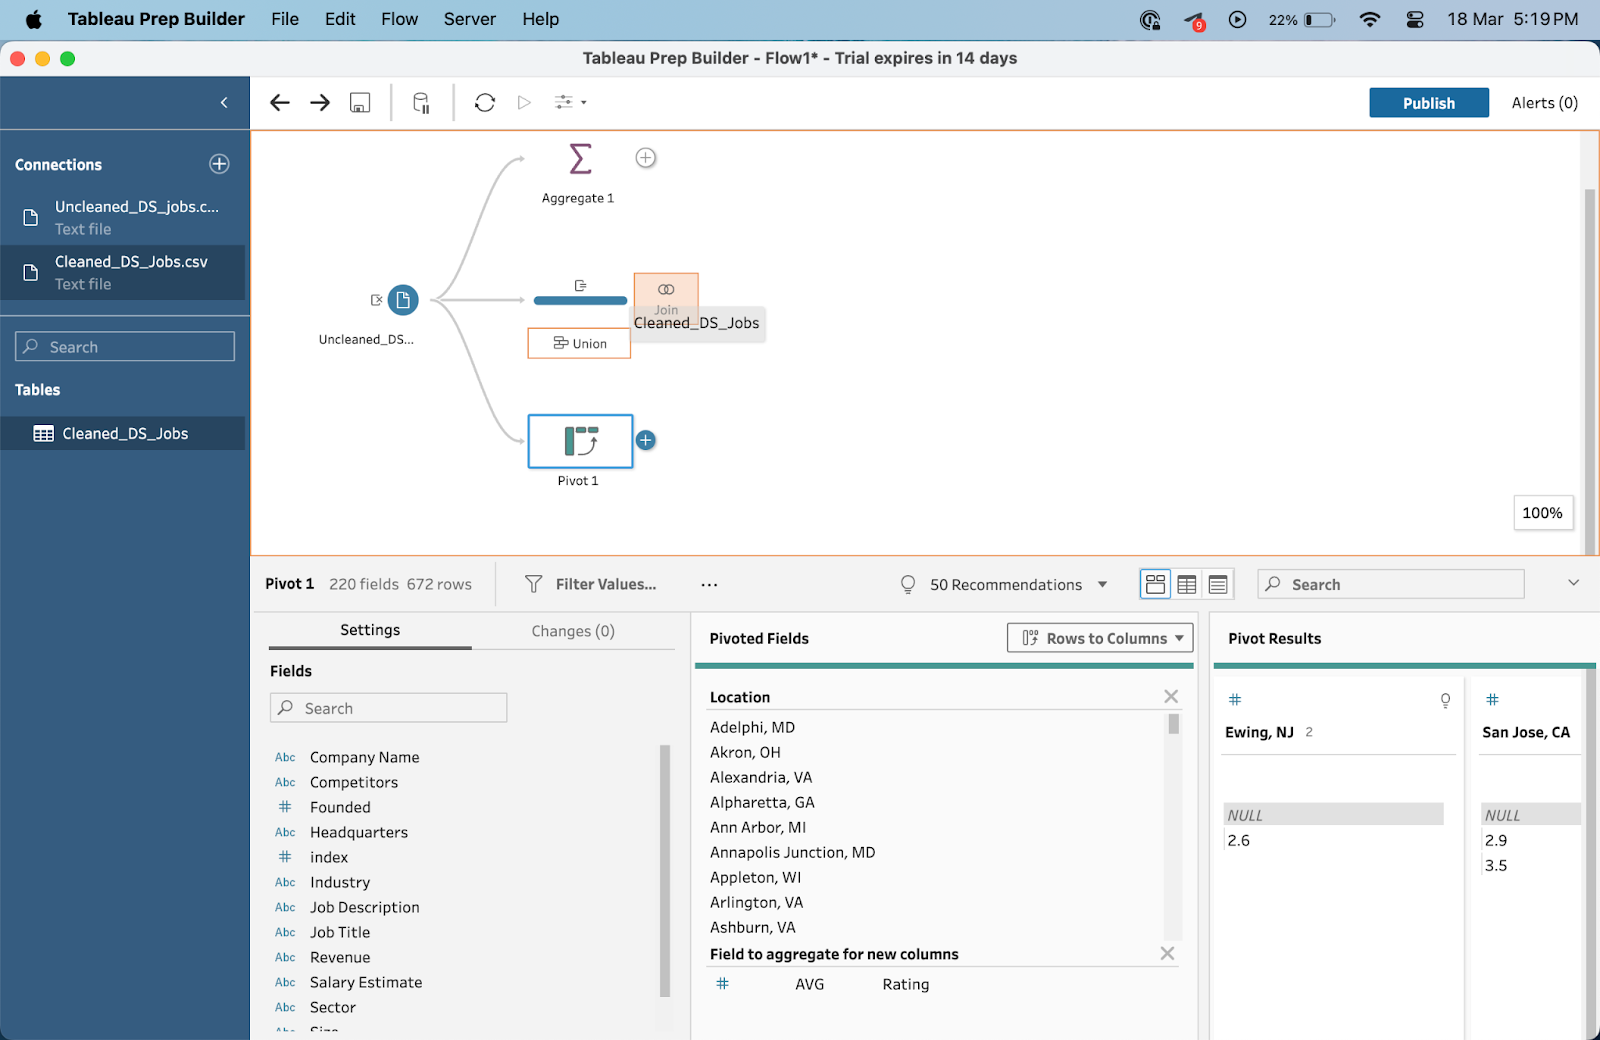
Drag and drop the Location and Rating to the Pivoted Fields panel. The pivot results should appear on the right side of your screen. Change the Sum of Rating to AVG instead for a better calculation.
This is what our Pivot Results should look like:
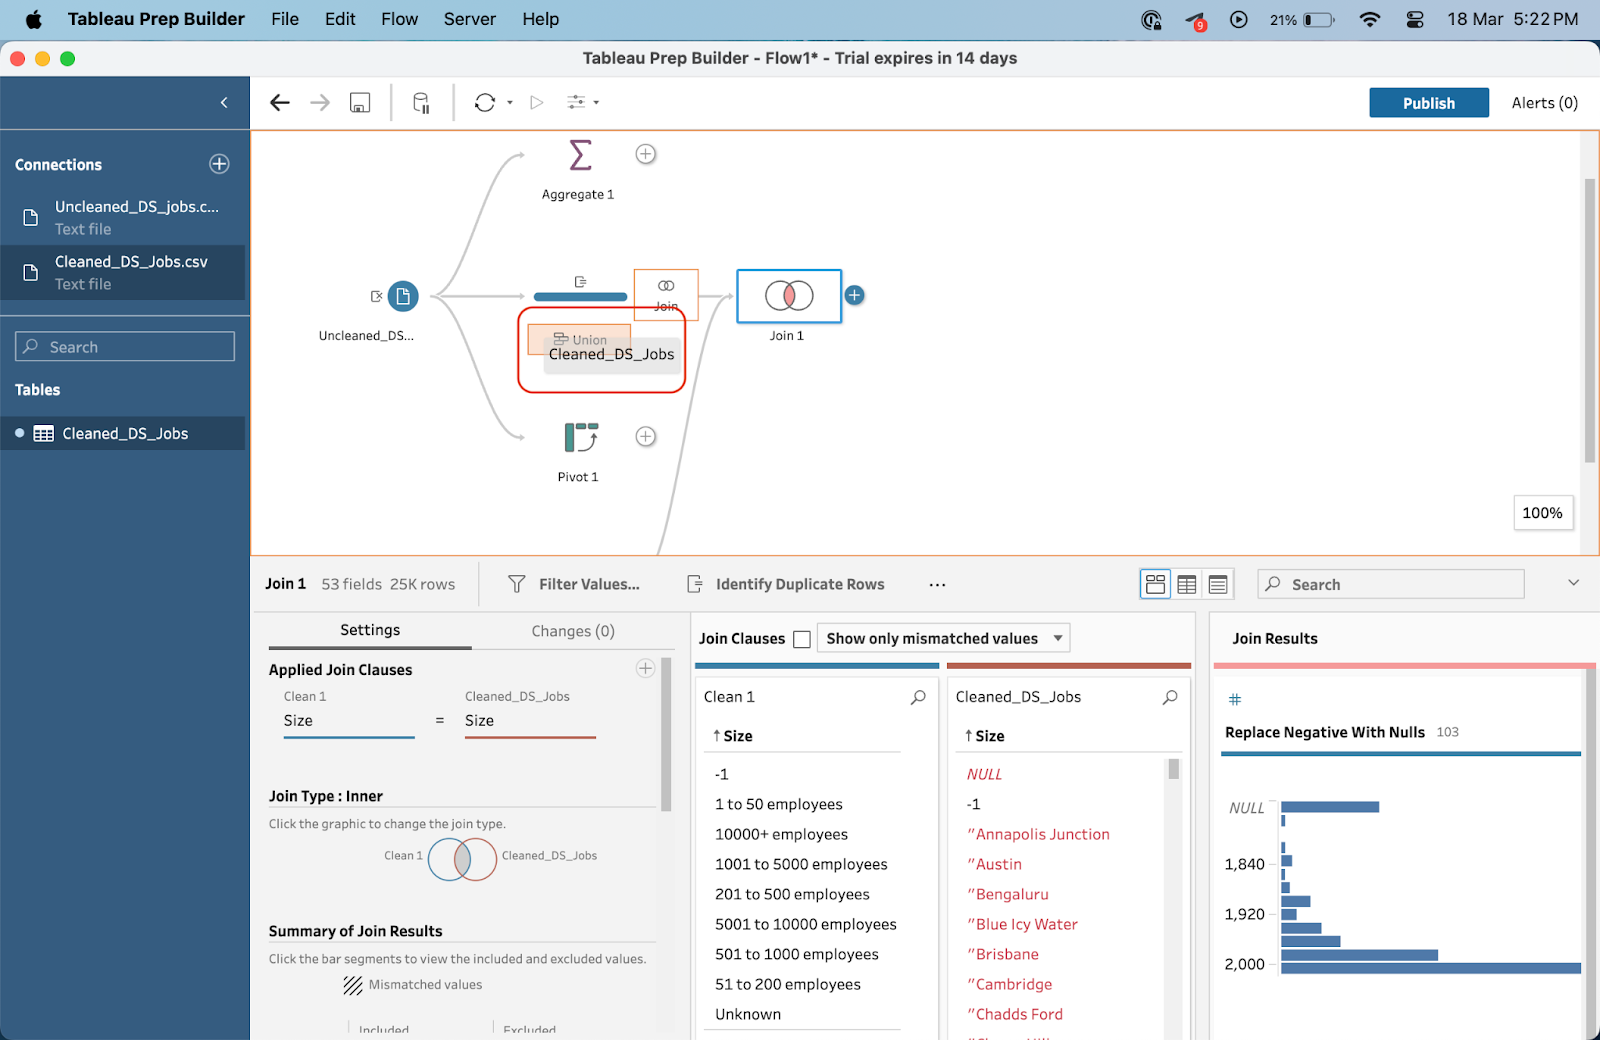
To create a join, you’ll need to have several tables loaded into your Tableau Prep Flow. In this case, we’ll use the cleaned data found in the same Kaggle dataset.
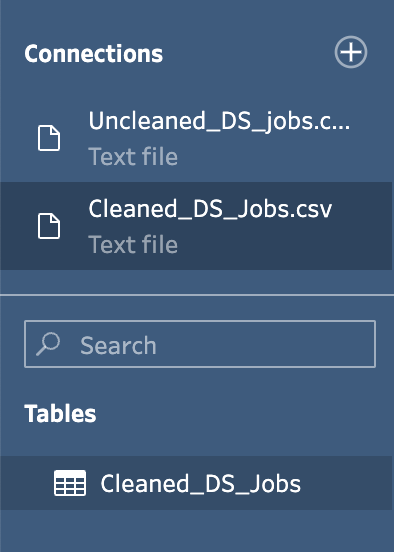
Drag the Cleaned_DS_Jobs table on the left onto the Cleaned dataset we made in our first step.
After dropping it onto the Join popup, you should see a new Join interface appear below.
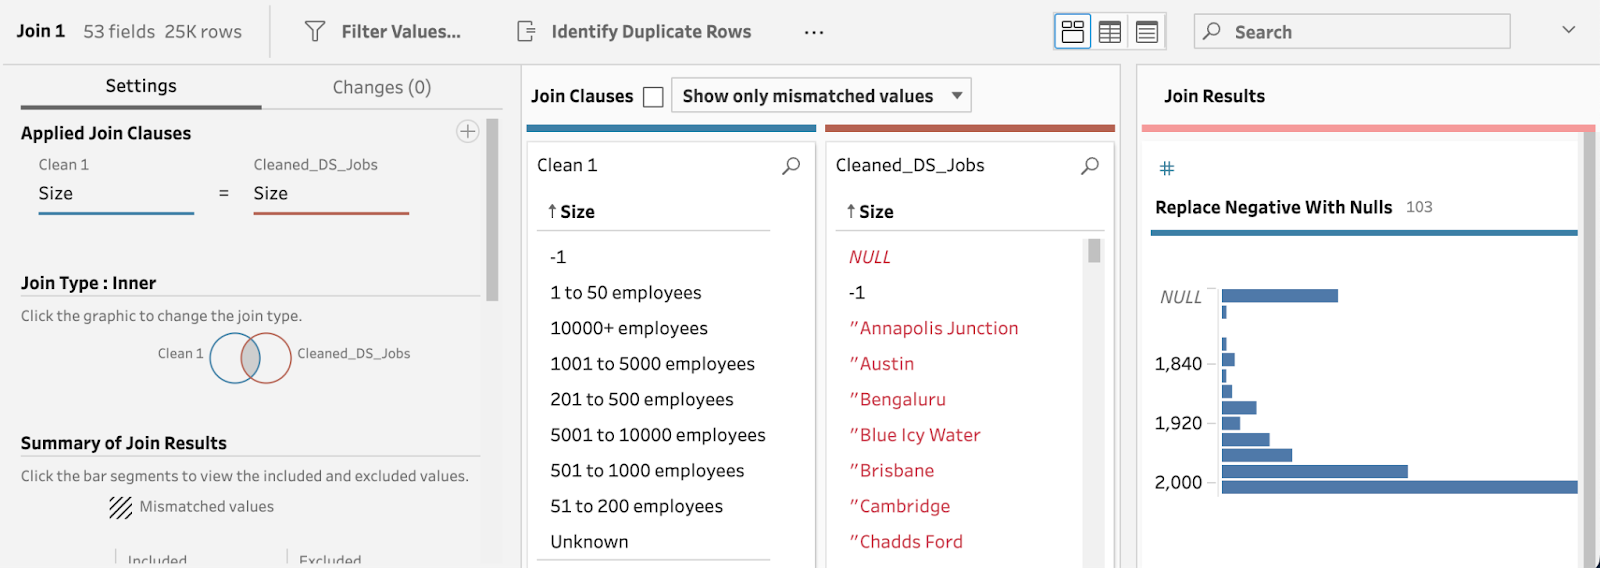
This means your join is ready. From this interface, you can see how the two tables are joined together and which join clause is used. In this case, Tableau Prep automatically chose an inner join type.
Doing a union is very much similar to joining in Tableau Prep. Simply drag and drop the Cleaned_DS_Jobs onto the initial cleaned dataset.
A union with the following interface will appear with more information on resulting and mismatched fields.
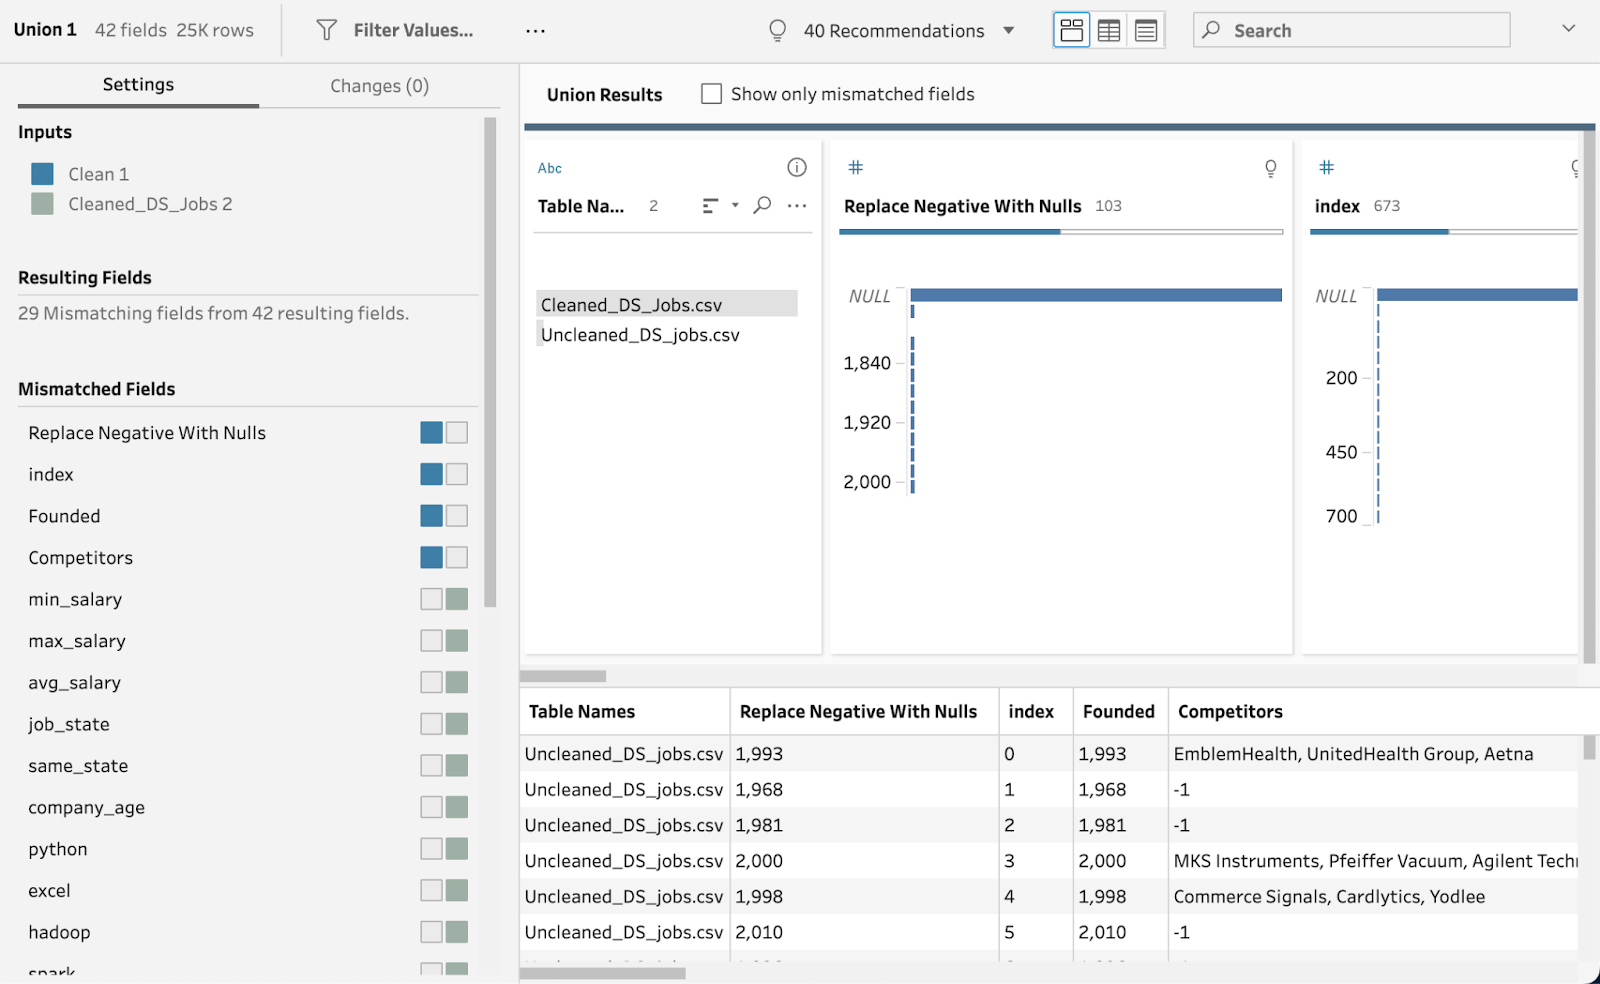
Tableau Prep is a powerful tool for cleaning, shaping, and preparing your data for analysis in Tableau. To get the most out of it and ensure your workflows are efficient and effective, follow these best practices:
Before you start, spend some time exploring your data to understand its structure, quality, and any cleaning or transformation it might need. This will help you plan out your flow and decide which steps to include.
You would typically start off by adding filtering steps first, followed by various cleaning and transformation steps. This makes sure that your dataset isn’t too large and helps with performance during the later steps of cleaning.
While Tableau Desktop is primarily used for visualizing data and creating interactive dashboards, Tableau Prep Builder is focused on data preparation and cleaning.
Tableau Desktop and Tableau Prep Builder are two powerful tools in the Tableau ecosystem, each with its own unique strengths and use cases.
Tableau Desktop allows users to connect to multiple data sources, blend them together, and visualize the results in a variety of charts and graphs. It also offers advanced features such as calculations, filters, parameters, and dashboard interactivity.
On the other hand, Tableau Prep Builder is specifically designed for preparing data before it can be visualized in Tableau Desktop. It has more features for data cleaning and shaping.
Tableau Prep Builder offers a user-friendly and intuitive interface for data preparation, making it accessible to users of all levels.
Other data prep tools may require more technical expertise or have a steeper learning curve.
Here’s a comparison of Tableau Prep Builder and other commonly used tools:
|
Feature/Tool |
Tableau Prep Builder |
Microsoft Power BI |
Alteryx |
Google Data Studio |
|
Data Preparation |
Advanced |
Moderate |
Advanced |
Basic |
|
Ease of Use |
User-friendly, intuitive |
Very user-friendly |
Steep learning curve |
User-friendly |
|
Integration |
Wide range of data source support |
Extensive integration with Microsoft products |
Wide range of data sources |
Limited to Google products and some third-party sources |
|
Visualization & Analytics |
Requires Tableau for full analysis |
Comprehensive built-in tools |
Requires additional tools |
Basic built-in tools |
|
Real-time Data Support |
Yes |
Yes |
Yes |
Yes |
|
Collaboration Features |
High (with Tableau Server/Online) |
High |
Moderate |
High |
|
Cost |
Higher |
Lower (with a free version) |
Higher |
Free (with limitations) |
|
Cloud-based Option |
Yes (Tableau Online) |
Yes |
Yes |
Yes |
|
Custom Scripting |
Advanced (with DAX, M) |
Advanced |
Limited |
Tableau Prep's user-friendly interface makes it accessible to all levels of users, from beginners to advanced analysts. The drag-and-drop functionality allows for easy manipulation of data fields, while the visual representation of data flows makes it easier to understand and spot any errors or discrepancies.
Tableau Prep seamlessly integrates with Tableau Desktop and Server, allowing for streamlined data preparation and analysis in one platform. This eliminates the need to switch between multiple tools, saving time and effort.
This also makes it easier for your data to live within one platform, boosting productivity while keeping data secure.
With features such as shared data sources and published flows, Tableau Prep promotes collaboration among team members working on the same dataset.
Changes made by one user can be viewed and accessed by others, ensuring everyone is using the most up-to-date data.
Compared to other data preparation tools, Tableau Prep has a limited set of features. It does not have advanced automation capabilities or built-in machine-learning algorithms for data cleansing and transformation.
On the other hand, other data prep tools like Alteryx or Talend have a much more extensive toolkit when it comes to ETL (extract, transform, load) tasks.
Tableau Prep is primarily designed for use with Tableau desktop and server, limiting its integration with other popular data visualization and analysis tools. This can be a drawback for teams that use multiple platforms in their data analytics process.
For example, in comparison to Power BI’s data prep function, Tableau is less versatile in terms of integration with the Microsoft ecosystem and tech stack.
Tableau Prep Builder makes it easy to automate data transformation workflows. In this article, we covered the interface navigation and features available in Tableau Prep Builder.
With its powerful capabilities, intuitive interface, and collaborative potential, Tableau Prep is a valuable tool for any data-driven organization.
Are you looking for a way to start learning Tableau? Give our Introduction to Tableau course a try to learn all the basics.
Keep Improving Your Tableau Skills
track
course
course
blog
Wendy Gittleson
19 min
tutorial
Eugenia Anello
13 min
tutorial
Austin Chia
tutorial
Chloe Lubin
7 min
tutorial
Parul Pandey
14 min
tutorial
Zoumana Keita
8 min