course
Introduction to Power BI
4 hours
361.1K
Master the world's most popular business intelligence tool.
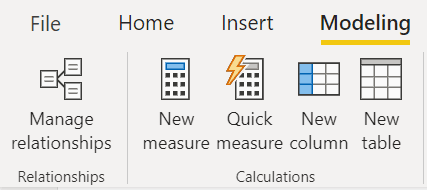
To use CALCULATE, simply add a measure to your table. You can do this by navigating to the Modeling tab in the Ribbon and selecting ‘New Measure’.
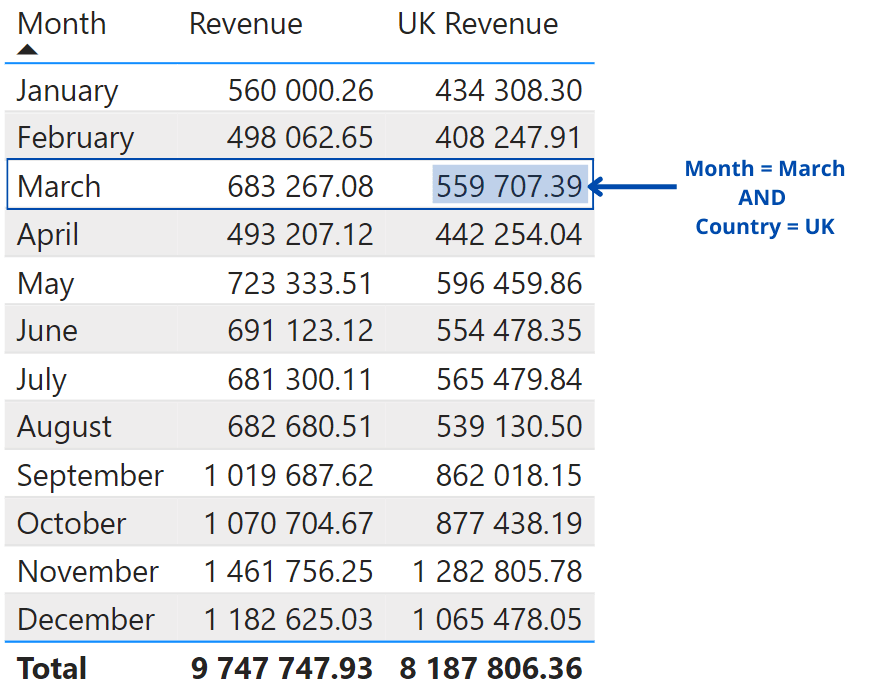
Below is a simple example of the CALCULATE function using SUM to find total revenue and filtering for Country = United Kingdom. We’ll discuss this example again in more detail at the end of the tutorial.
UK Revenue = CALCULATE(SUM('Online Retail'[Revenue]),

               'Online Retail'[Country] = "United Kingdom")
When viewed in a table, we can see that the UK Revenue measure is simply applying a filter for Country in addition to the filter context that is already present in the table for Month. Using the CALCULATE function in this way gives us more fine-grained control over what kind of information is displayed in our visual.
An important thing to keep in mind when creating measures is to follow good data modeling practices specifically in terms of the speed and optimisation of your queries. Because of this, some uses of the CALCULATE function are faster or more appropriate than others.
For example, the Microsoft documentation recommends that you avoid using the FILTER function as an argument to other functions (such as in the CALCULATE function). Instead, it’s better to use boolean expressions where possible since they are explicitly optimized for this purpose.
In the above example we used a boolean expression to define our filter for Country = United Kingdom. This is a faster and more optimized approach. On the other hand, here is an example of the FILTER function where we get the same result but the calculation is slower:
UK Revenue = CALCULATE(SUM('Online Retail'[Revenue]),
              FILTER('Online Retail',
'Online Retail'[Country] = "United Kingdom")Using a real-world e-commerce dataset, we’ll be exploring a few key ways that the CALCULATE function can be used to solve business problems. To follow along with this tutorial, you can access the e-commerce dataset hosted on DataLab.
This dataset contains information about each purchase that a customer makes: the country it was purchased from, the product description, the date and time of purchase, and the quantity and price of each product purchased.
We will be answering the following questions with the help of the CALCULATE function:
To answer this question, we will need to create two measures using the CALCULATE function. First, we use a simple boolean filter to create a measure that returns the total revenue (using a SUM function) in the UK:
UK Revenue = CALCULATE(SUM('Online Retail'[Revenue]),
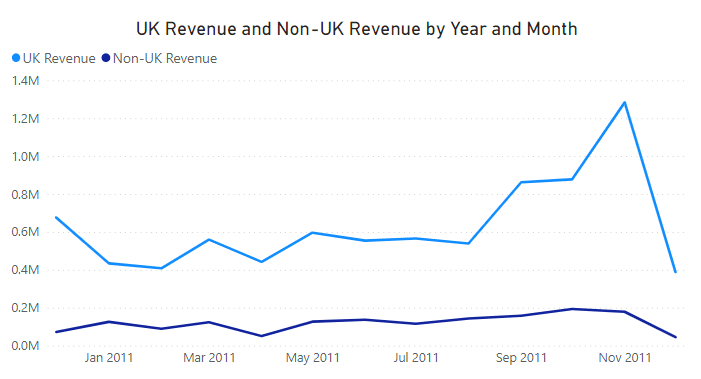
'Online Retail'[Country] = "United Kingdom")Next, we create a similar measure but this time we use the FILTER function. This filter expression runs through each row of the Country column and returns a table containing the rows that match the filter condition. The FILTER function is required here because we are not able to return a simple TRUE or FALSE from the filter. Instead, we get a table with multiple values.
Non-UK Revenue = CALCULATE(SUM('Online Retail'[Revenue]),
                    FILTER('Online Retail',
                        'Online Retail'[Country] <>"United Kingdom")
Therefore, we can see that the UK makes up the majority of the revenue for this e-commerce store compared to all other countries.
This is a very common type of question faced by Power BI developers and users and it is a perfect case to apply the CALCULATE function.
In order to find the percentage of a total, we first need to be able to return the total without it being affected by other filter contexts in the report. To achieve this we use a filter modifier known as the ALL function. Using this function, we specify which column we would like our calculation to completely ignore any filters for.
In this example, we are looking for the percentage of total revenue in the UK. This means that our calculation should ignore any filters in the Country column.
Total Revenue = CALCULATE(SUM('Online Retail'[Revenue]),
                  ALL('Online Retail'[Country]))
This is relevant because CALCULATE can be executed from inside a filter context that is already filtering Product[Color]. In that scenario, the presence of ALL means that the outer filter over Product[Color] is ignored and replaced with the new filter introduced by CALCULATE. This is evident if instead of slicing by Brand, we slice by Color in the matrix.
Now that we know our total revenue, we can construct a measure to show the percentage of total revenue. However, since we are specifically interested in the UK, we will use the CALCULATE function once again but this time we will use a simple boolean filter.
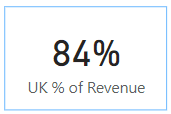
UK % of Revenue = CALCULATE(SUM('Online Retail'[Revenue])/[Total Revenue],
                    'Online Retail'[Country] = "United Kingdom")
Now we can see that the UK makes up 84% of the total revenue for this e-commerce store.
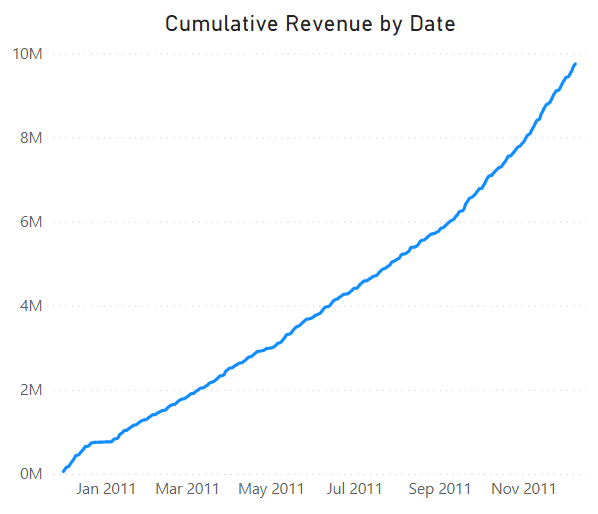
The cumulative revenue can give some insight into the revenue trends. By plotting this cumulative revenue on a chart, we can also visually see if revenue has increased at a faster rate or not over time.
To answer this question, we must create a measure using the CALCULATE function as well as these filter functions: ALLSELECTED, FILTER, and an evaluation using the MAX function.
Cumulative Revenue = CALCULATE(SUM('Online Retail'[Revenue]),
                FILTER( ALLSELECTED('Online Retail'[InvoiceDate]),
                'Online Retail'[InvoiceDate] <= MAX('Online Retail'[InvoiceDate])))
Let’s go over why these filters are important here:
In this tutorial, we discussed what the CALCULATE function is in Power BI and how to use it. We also applied the CALCULATE function to a real-world e-commerce dataset and used it to answer some key business questions.
CALCULATE is one of the most useful functions in Power BI and you will likely need to use it frequently when building reports and generating deeper insights into your data.
Hopefully, this tutorial helps you not only understand the basic syntax of CALCULATE but also how it relates to solving real business problems as a Power BI data analyst.
Prepare for Microsoft's PL-300 and get 50% off the exam fee.
Courses for Power BI
course
course
course
tutorial
DataCamp Team
16 min
tutorial
Kafaru Simileoluwa
18 min
tutorial
DataCamp Team
9 min
tutorial
Kafaru Simileoluwa
12 min
tutorial
Parul Pandey
16 min
tutorial
Joleen Bothma
9 min