HomeTutorialsPower BI

Power BI DAX Tutorial for Beginners

Learn what DAX is and discover the fundamental DAX syntax and functions you'll need to take your Power BI skills to the next level.
Apr 2022  · 9 min read

What is DAX?

DAX or Data Analysis Expressions drive all the calculations you can perform in Power BI. DAX formulas are versatile, dynamic, and very powerful – they allow you to create new fields and even new tables in your model. While DAX is most commonly associated with Power BI, you can also find DAX formulas in Power Pivot in Excel and SQL Server Analysis Services (SSAS).

DAX formulas are made up of 3 core components and this tutorial will cover each of these:

  • Syntax – Proper DAX syntax is made up of a variety of elements, some of which are common to all formulas.
  • Functions – DAX functions are predefined formulas that take some parameters and perform a specific calculation.
  • Context – DAX uses context to determine which rows should be used to perform a calculation.

Why is DAX Important in Power BI?

DAX formulas allow you to get the most out of your data and Power BI in order to solve business problems efficiently. You can perform simple calculations (such as a simple sum or average) and create most visuals without even touching DAX. For example, if you wanted to create a simple chart showing total profit you could simply drag the profit field onto the Values section of the chart, and it would perform a sum of the rows in that field. 

There are two cases where it would be better to create a DAX formula:

  1. If you wanted to re-use a formula in multiple places, such as in multiple charts or as an expression in other DAX formulas. In this case, using a DAX formula would make your report more efficient and easier to change in the future since you would only need to change a single formula rather than changing many individual formulas in each place they are used.
  2. If you wanted to create complex or customized formulas where just a simple SUM or AVERAGE would not be sufficient for the business problem you were trying to solve.

Where are DAX Formulas Used in Power BI?

There are three ways you can use DAX formulas in Power BI:

  1. Calculated Tables - These calculations will add an additional table to the report based on a formula. 
  2. Calculated Columns - These calculations will add an additional column to a table based on a formula. These columns are treated like any other field in the table.
  3. Measures - These calculations will add a summary or aggregated measure to a table based on a formula. 

The main difference between these three types of calculations is in their context (more on this later) and the outputs they produce. 

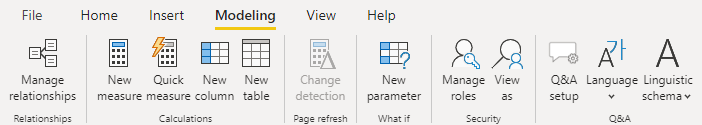
To add any one of these types of calculations to a model, navigate to the Modeling tab of the ribbon. Here you will find three choices for adding either a new measure, calculated column, or table. Alternatively, you can right-click a table in the Fields pane, and you will get the option to add a new measure or calculated column in the drop-down menu. 

Power BI Drop-down Menu

Start Learning Power BI For Free

Introduction to DAX in Power BI

BeginnerSkill Level
2 hr
62K learners
Enhance your Power BI knowledge, by learning the fundamentals of Data Analysis Expressions (DAX) such as calculated columns, tables, and measures.

How to Write a DAX Formula

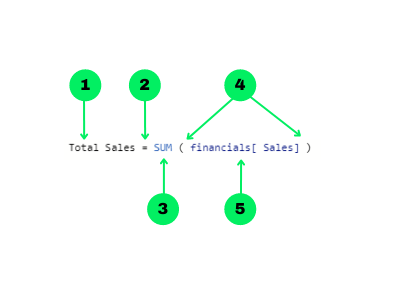
DAX formulas are intuitive and easy to read. This makes it easy to understand the basics of DAX so you can start writing your own formulas relatively quickly. Let’s go over the building blocks of proper DAX syntax. 

Dax Formula Composition Infographic

  1. The name of the measure or calculated column
  2. The equal-to operator (“=”) indicates the start of the formula
  3. A DAX function
  4. Opening (and closing) parentheses (“()”)
  5. Column and/or table references
  6. Note that each subsequent parameter in a function is separated by a comma (“,”)

DAX functions can also be nested inside each other to perform multiple operations efficiently. This can save a lot of time when writing DAX formulas. For example, it is often useful to have multiple nested IF statements or to use the IFERROR function to wrap around another function, so that any errors in the formula are represented by the value you specify. 

Some of the most common DAX functions used in reports are:

  1. Simple calculations: COUNT, DISTINCTCOUNT, SUM, AVERAGE, MIN, MAX.
  2. SUMMARISE: Returns a table typically used to further apply aggregations over different groupings.
  3. CALCULATE: Performs an aggregation along with one or more filters. When you specify more than one filter, the function will perform the calculation where all filters are true.
  4. IF: Based on a logical condition, it will return a different value for if it is true or false. This is similar to the CASE WHEN operation in SQL.
  5. IFERROR: Looks for any errors for an inner function and returns a specified result
  6. ISBLANK: Checks if the rows in a column are blank and returns true or false. Useful to use in conjunction with other functions like IF.
  7. EOMONTH: Returns the last day of the month of a given date (column reference in a date format) for as many months in the past or the future.
  8. DATEDIFF: returns the difference between 2 dates (both as column references in date formats) in days, months, quarters, years, etc.

Understanding Context in DAX Formulas

DAX formulas in Power BI are dynamic, and they change according to the context in which they were created. It’s important to have an understanding of how contexts work in DAX, as it can help save you a lot of headaches when you run into confusing errors in your formulas. 

There are two main types of context in DAX: row context and filter context.

Row Context

This refers to just “the current row” across all columns of a table and also extends to all columns in related tables too. This type of context lets the DAX formula know which rows to use for a specific formula.

Here is an example of a formula for a calculated column that has a row context:

Cost Price Per Unit = financials[COGS] / financials[Units Sold]

Power BI Calculated Column Screen Shot

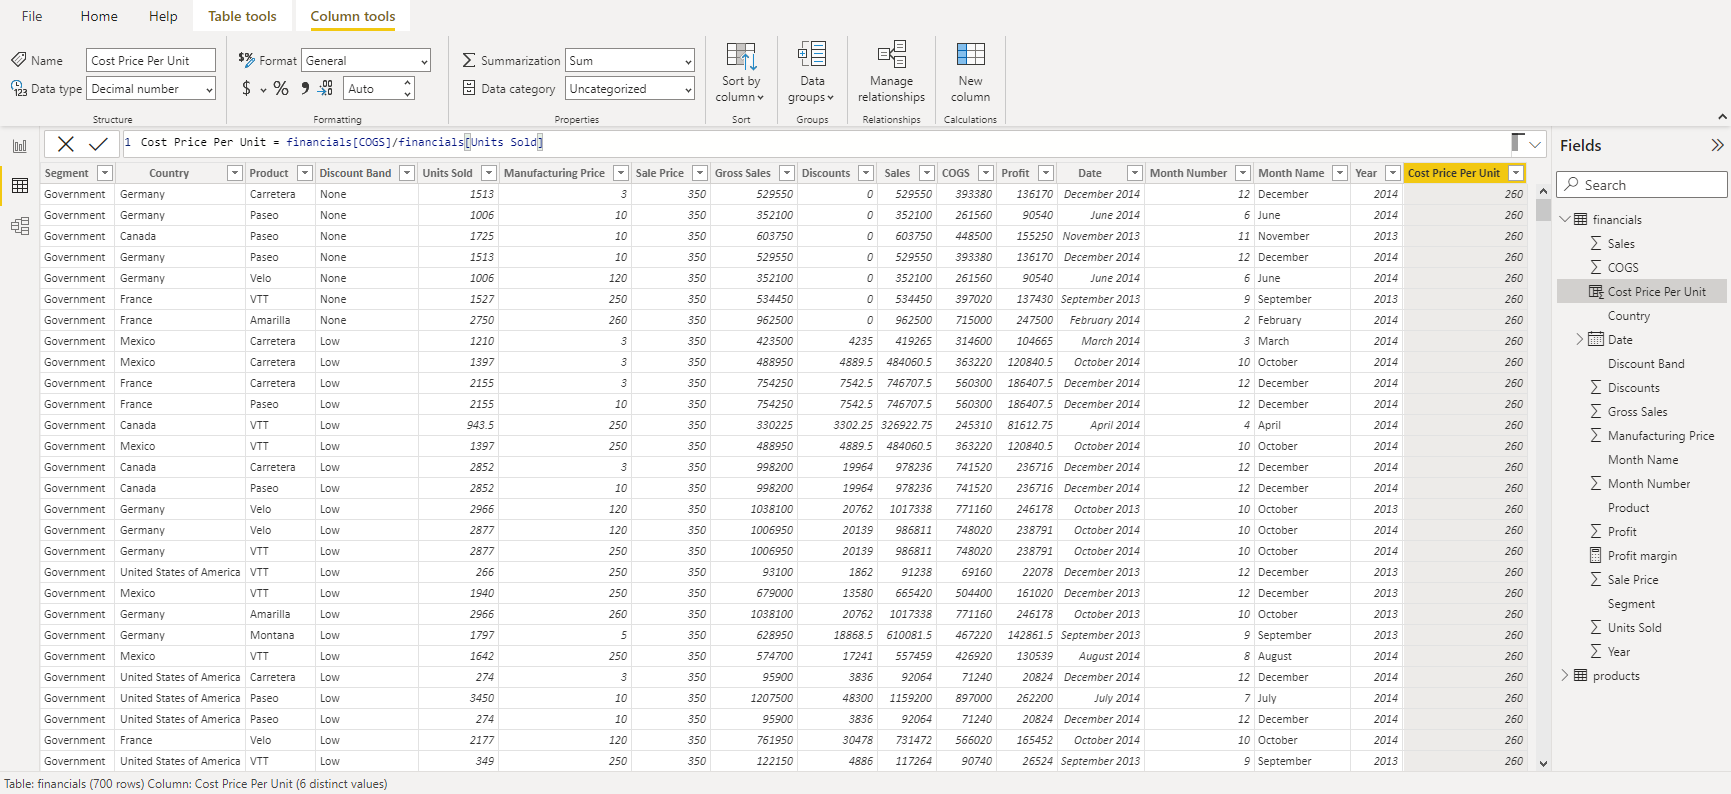
In this example, the calculation of Cost Price Per Unit is done on a row-by-row basis. This means that DAX needs to know what the current row is as it proceeds through the dataset, making the calculation and populating the new column with the result.

Row context is implicit in calculated columns. This is because the calculations that are performed in calculated columns are done on a row-by-row basis, and thus the row context is defined by default. However, this is not the case in measures since the aggregations are applied for all rows in a table. These calculations do not need to have any knowledge of a current row since all rows are aggregated together. 

As an example of a measure, consider the following DAX formula:

Profit margin = SUM ( financials[Profit] ) / SUM ( financials[Sales] )

In this case, the entire Profit column is summed to produce a single number, and this is divided by the sum of the entire Sales column. DAX does not need to know the current row, since it is performing an aggregation. Thus, this measure has no row context.

To explicitly define a row context in a measure, you need to use a special function called an iterator. Examples of iterator functions are SUMX, AVERAGEX, and COUNTX. These functions will first perform a calculation on a row-by-row basis, and then perform the final aggregation on the result (ie. sum, average, count, etc.). In this way, the row context is defined explicitly by the use of these iterators.

Let’s take a look at an example of an iterator function in action:

Average Cost Per Unit = AVERAGEX ( financials, financials[COGS] / financials[Units Sold] )

This example performs two calculations: first, the expression is evaluated on a row-by-row basis, and then the result is applied to the AVERAGE function. An alternative way of reaching this same result is to first create the calculated column ‘Cost Price Per Unit’ as we did above and then create a separate AVERAGE measure of that column. However, knowing when to use these iterator functions can make your reports more efficient and use up less memory as you are effectively able to perform two calculations using just a single formula.

Filter Context 

Filter context is applied on top of a row context and refers to a subset of rows or columns that are specified as filters in the report. Filters can be applied in a few ways:

  • Directly in a DAX formula
  • Using the filters pane
  • Using a slicer visual
  • Through the fields that make up a visual (such as the rows and columns in a matrix)

A good example of how to add a filter context to a DAX formula is to use the CALCULATE function, which allows you to add one or more filter parameters to the measure. In the example below, we create a profit margin measure filtered for USA only:

USA Profit Margin =

CALCULATE ( SUM ( financials[Profit] ) / SUM ( financials[Sales] ),  financials[Country] = "United States of America")

Conclusion

You now have some basic DAX tools to try out, and they are just the tip of the iceberg of all that DAX can do. With 250 possible functions to learn, the road to DAX mastery is both challenging and rewarding. We’ll cover more advanced functions in our Advanced DAX tutorial, and you can start taking your DAX skills to the next level today with our Dax in Power BI course. Or, you can read more about why Power BI is one of the best skills to learn here.  

Power BI DAX FAQ's

What is DAX in Power BI?

DAX or Data Analysis Expressions, allow you to perform calculations that create new fields and even new tables in your model.

What does DAX stand for in Power BI?

Data Analysis Expressions

How to write a DAX formula in Power BI?

DAX formulas are entered into the formula bar just below the ribbon in Power BI. Start by giving the formula a name and then follow with the equal-to sign (“=”). Then write in your formula using functions, constants, or strings.

How to write a DAX measure in Power BI?

Create a DAX measure by selecting ‘New Measure’ from the Modeling tab of the ribbon or by right-clicking a table in the Fields pane and selecting ‘New Measure’ from the drop-down. 

How to create a ‘case when’ formula using DAX in Power BI?

The ‘case when’ formula is created using the IF function in a DAX formula. 

How to join two tables in Power BI using DAX?

The easiest way to join two tables is to leverage existing relationships between the tables and use the ADDCOLUMNS function to add additional columns to a table. This function performs a left join.

How to use the where clause using DAX in Power BI?

The where clause is easily applied using filter parameters in DAX. For example, the CALCULATE function takes an expression and multiple optional filter parameters. This helps to control how charts and user input influences these functions. 

How to create static tables in Power BI using the DATATABLE DAX function?

The DATATABLE function is an easy and convenient way to create static tables that do not refresh unless the DAX function is explicitly changed. The DATATABLE syntax is:

DATATABLE (

    <column1_name>, <column1_datatype>,

    <column2_name>, <column2_datatype>,

    {

        { <value1_row1>, <value2_row1> },

        { <value1_row2>, <value2_row2> }

    }

)

How to replace values in Power BI using DAX?

There are two ways to replace string values in a column using DAX and that is with the REPLACE and the SUBSTITUTE functions. The REPLACE function will replace a string based on the exact position and number of characters you specify. On the other hand, the SUBSTITUTE function will replace any exact match string, regardless of its position.

How do I learn to use DAX in Power BI?

DataCamp's DAX in Power BI. The course teaches a vast range of beginning to advanced DAX calculations and the best way to use them in your reports. 

Topics
Related

Power BI Certification: A Comprehensive Guide to Choosing The Right Path

Unlock your potential with our guide to Power BI certification: preparation tips, DataCamp resources, and career benefits.
Matt Crabtree's photo

Matt Crabtree

10 min

Top 10 Business Intelligence Conferences in 2024

An overview of the top 10 international business intelligence conferences planned for 2024, including their dates, participation fees, formats, hosting cities, main focus, key discussion topics, and target audience.
Elena Kosourova's photo

Elena Kosourova

5 min

Mastering SWITCH in DAX for Power BI: A Comprehensive Guide

Explore the Power BI SWITCH function, what it is, how to use it, and some common pitfalls and best practices.
Joleen Bothma's photo

Joleen Bothma

10 min

A Step-By-Step Guide to Visualizing KPIs in Power BI

Learn how to effectively visualize KPIs in Power BI using visuals and DAX measures.
Joleen Bothma's photo

Joleen Bothma

8 min

Power BI Slicer Tutorial: A Comprehensive Guide to Enhancing Your Reports

Unlock the power of Power BI slicers with our step-by-step tutorial. Learn to create, customize, and optimize slicers for better reports.
Joleen Bothma's photo

Joleen Bothma

7 min

Complete Guide to Power BI Conditional Formatting

Learn how to use conditional formatting to boost your Power BI reports.
Joleen Bothma's photo

Joleen Bothma

7 min

See MoreSee More