By continuing, you accept our Terms of Use, our Privacy Policy and that your data is stored in the USA.
HomeResourcesWebinars

Going from Excel to Tableau with DataCamp

Webinar

In this webinar, you’ll discover the power of Tableau. You will learn how business intelligence tools like Tableau are transforming analytics in companies all over the globe in a variety of industries by looking at real-world examples.

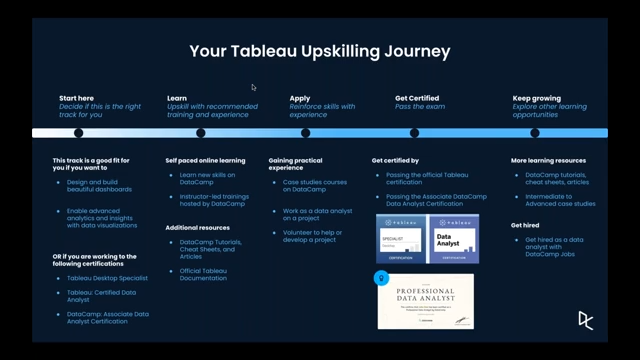
You’ll also get an in-depth overview of the new Data Analyst in Tableau career track on DataCamp, which enables any individual or team to learn key Tableau skills such as data exploration and analysis, data visualization, dashboard creation, and more. Finally, you’ll learn about how Tableau upskilling can accelerate individual and organizational outcomes.

Key Takeaways

  • How Tableau empowers individuals and organizations to drive value with data

  • An overview of the new DataCamp Data Analyst in Tableau Career Track

  • How Tableau upskilling can help drive individual and organizational outcomes with data

Summary

Transitioning from Excel to Tableau offers a substantial upgrade in data analysis capabilities, allowing individuals and teams to illustrate data at scale without coding knowledge. This shift is made easier by platforms like DataCamp, which provide a comprehensive learning plan for aspiring data analysts. The focus is on making data insights accessible for all levels within an organization, from executives to analysts. This shift aligns with the growing demand for data skills in the job market, where proficiency in tools like Tableau is increasingly becoming a prerequisite. The webinar highlighted the expanding roles of business and data analysts, noting a significant growth rate in these positions due to the rising importance of data-driven decision-making. Tableau, as a leader in business intelligence tools, empowers users by simplifying complex data illustration tasks, enhancing data literacy, and promoting a data-driven culture within organizations. The discussion also covered the structured learning plan provided by DataCamp, which assists learners in mastering Tableau through a series of courses and case studies, ultimately preparing them for industry-recognized certifications. Key features of Tableau, such as its integration with existing data sources and its ability to handle big data, were highlighted as critical advantages over traditional tools like Excel. The session concluded by emphasizing the necessity of continuous learning in the ever-changing field of data analytics and how platforms like DataCamp can support this through various resources, including courses, certifications, and community engagement opportunities.

Key Takeaways:

  • Tableau enhances data analysis by enabling illustration at scale without coding.
  • Proficiency in Tableau is increasingly demanded in the job market, with a significant number of job listings requiring this skill.
  • DataCamp offers a structured learning plan to help learners transition from Excel to Tableau, preparing them for certifications.
  • Tableau's integration with existing data sources and big data capabilities offers a competitive edge over Excel.
  • Continuous learning is important in data analytics, and platforms like DataCamp provide valuable resources for skill development.

Deep Dives

Transitioning from Excel to Tableau

The transition from Excel to Ta ...
Read More

bleau represents a considerable evolution in data analysis, one that empowers analysts to illustrate and interpret data with greater efficiency and insight. Unlike Excel, which is primarily spreadsheet-based, Tableau is a solid business intelligence tool that allows users to create interactive and shareable dashboards. This capability is especially beneficial for organizations aiming to make data insights accessible across various levels, from executives to frontline workers. Tableau's no-code approach is particularly appealing as it lowers the entry barrier, enabling individuals without a technical background to use its full potential. "Tableau skills carry a salary premium," noted Adel, emphasizing the tool's value in the job market and the role it plays in driving data-driven decision-making within organizations.

The Growing Importance of Data Skills

In today's data-centric economy, the ability to interpret and leverage data is becoming indispensable. The roles of business analysts and data analysts are among the fastest-growing, with projections indicating a growth rate of 7% to 25% in the US by 2030. This surge is driven by the increasing demand for data-driven insights and the need for organizations to make informed decisions. Tableau, as highlighted in the webinar, is a key player in fulfilling this demand. It offers a user-friendly interface that simplifies the process of creating detailed and interactive data illustrations. This ease of use, combined with its powerful analytical capabilities, makes Tableau an essential tool for professionals looking to advance their careers in data analytics.

Empowering Teams with Tableau

Tableau not only benefits individual analysts but also serves as a critical asset for teams. By facilitating the creation of dashboards and illustrations, Tableau supports a culture of data literacy and informed decision-making within organizations. Its smooth integration with existing data sources like SQL Server and Google Cloud further enhances its utility, allowing teams to work with large datasets effortlessly. As mentioned in the webinar, Tableau's capabilities in handling big data and providing advanced analytics tools give it a significant edge over traditional tools such as Excel. This advantage is important for organizations aiming to promote a data-driven culture and leverage data insights for strategic decision-making.

DataCamp's Role in Upskilling

DataCamp plays an important role in equipping learners with the necessary skills to master Tableau. The platform offers a comprehensive learning plan that guides users from beginner to intermediate levels, including courses and case studies aligned with industry certifications. This structured approach ensures that learners not only gain proficiency in Tableau but also develop a solid data analyst skill set. DataCamp's focus on interactive learning, as opposed to passive video-based methods, allows learners to engage with the content actively, reinforcing their understanding and application of Tableau's functionalities. The platform also supports continuous learning, providing resources such as tutorials, cheat sheets, and community-driven content to help users stay updated in the ever-changing field of data analytics.

Adel Nehme Headshot
Adel Nehme

VP of Media at DataCamp

VP of Media at DataCamp | Host of the DataFramed podcast
Carl Rosseel Headshot
Carl Rosseel

Head of Business Intelligence Curriculum at DataCamp

View More Webinars

Related

webinar

Exploring DataCamp's New Enterprise Dashboard

Get an overview of what DataCamp's new enterprise dashboard can do.

webinar

Live Training: Visualizing Cost Savings in Tableau

Build dashboards in Tableau, and add interactive elements to explore datasets.

webinar

DataCamp in Action — Data Upskilling for Your Organization

Learn how 2,500+ Businesses are using DataCamp to close their team’s skill gaps

webinar

DataCamp for Enterprise: Q3 2020 Roadmap

Learn about our product and content vision to easier manage your L&D programs.

webinar

DataCamp: Q2 2022 Roadmap

Learn more about the future of DataCamp and our most exciting new releases.

webinar

DataCamp for Enterprise: What’s New in 2020

Learn about the exciting new features and content for DataCamp Enterprise plans.

Hands-on learning experience

Companies using DataCamp achieve course completion rates 6X higher than traditional online course providers

Learn More

Upskill your teams in data science and analytics

Learn More

Join 5,000+ companies and 80% of the Fortune 1000 who use DataCamp to upskill their teams.

Don’t just take our word for it.