Generalized Linear Models in Python
Extend your regression toolbox with the logistic and Poisson models and learn to train, understand, and validate them, as well as to make predictions.
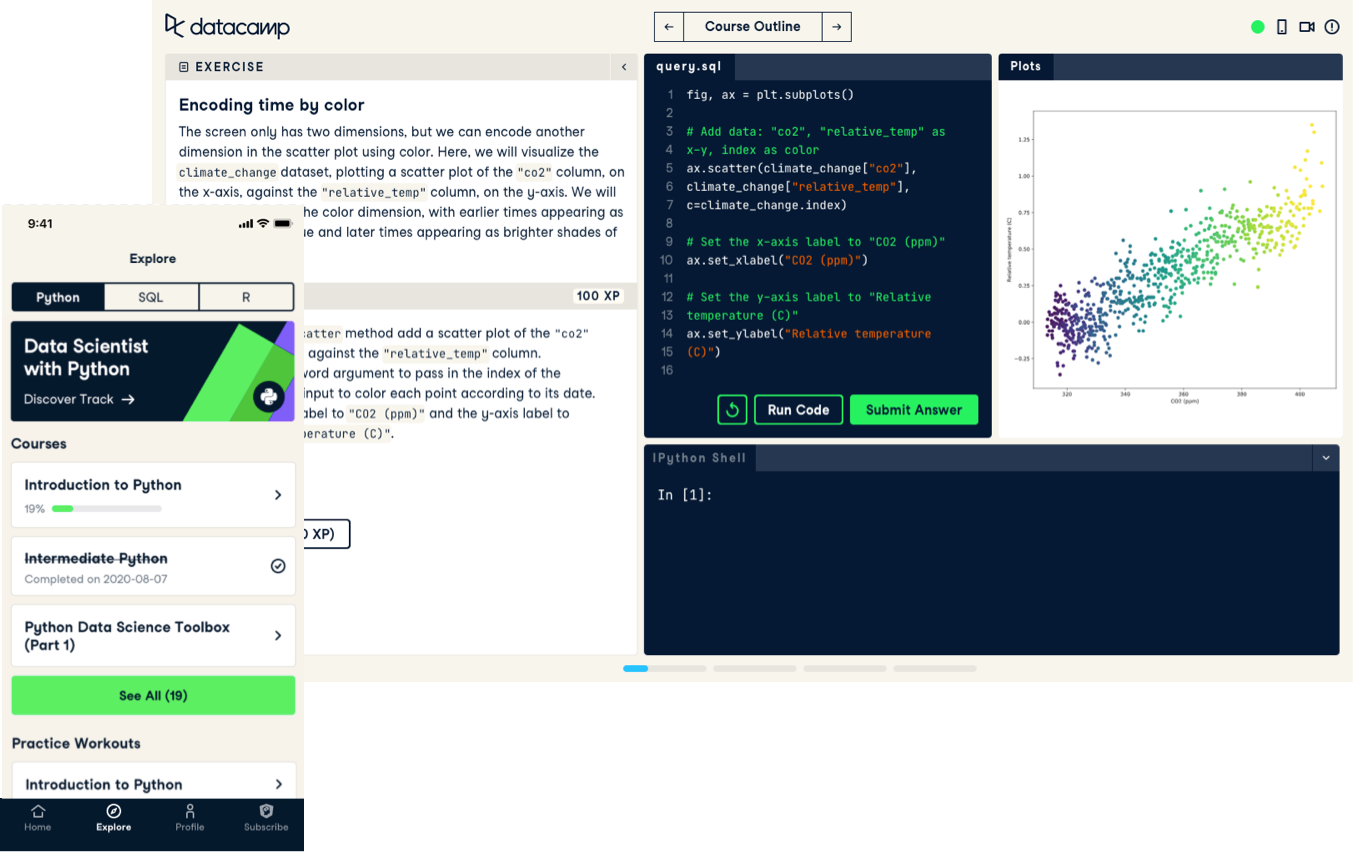
Follow short videos led by expert instructors and then practice what you’ve learned with interactive exercises in your browser.

Extend your regression toolbox with the logistic and Poisson models and learn to train, understand, and validate them, as well as to make predictions.
Learn how to efficiently collect and download data from any website using R.
Learn the theory behind responsibly managing your data for any AI project, from start to finish and beyond.
Discover how to use the income statement and balance sheet in Power BI
Learn basic business modeling including cash flows, investments, annuities, loan amortization, and more using Google Sheets.
Explore Alteryx Designer in a retail data case study to boost sales analysis and strategic decision-making.
Master Amazon Redshifts SQL, data management, optimization, and security.
Explore Data Version Control for ML data management. Master setup, automate pipelines, and evaluate models seamlessly.
Learn how to work with streaming data using serverless technologies on AWS.
Learn about MLOps architecture, CI/CD/CM/CT techniques, and automation patterns to deploy ML systems that can deliver value over time.
Learn about AWS Boto and harnessing cloud technology to optimize your data workflow.
Learn how bonds work and how to price them and assess some of their risks using the numpy and numpy-financial packages.
Master data fluency! Learn skills for individuals and organizations, understand behaviors, and build a data-fluent culture.
Use your knowledge of common spreadsheet functions and techniques to explore Python!
Learn to work with time-to-event data. The event may be death or finding a job after unemployment. Learn to estimate, visualize, and interpret survival models!
Learn to create interactive dashboards with R using the powerful shinydashboard package. Create dynamic and engaging visualizations for your audience.
In this Power BI case study you’ll play the role of a junior trader, analyzing mortgage trading and enhancing your data modeling and financial analysis skills.
Prepare for your next statistics interview by reviewing concepts like conditional probabilities, A/B testing, the bias-variance tradeoff, and more.
Learn what Bayesian data analysis is, how it works, and why it is a useful tool to have in your data science toolbox.
In this course youll learn how to perform inference using linear models.
Learn how to write recursive queries and query hierarchical data structures.
Sharpen your knowledge and prepare for your next interview by practicing Python machine learning interview questions.
Learn how to develop deep learning models with Keras.
Dive into our Tableau case study on supply chain analytics. Tackle shipment, inventory management, and dashboard creation to drive business improvements.
Make it easy to visualize, explore, and impute missing data with naniar, a tidyverse friendly approach to missing data.
This Power BI case study follows a real-world business use case on tackling inventory analysis using DAX and visualizations.
Learn how to make GenAI models truly reflect human values while gaining hands-on experience with advanced LLMs.
In this course youll learn how to leverage statistical techniques for working with categorical data.
Discover how the Pinecone vector database is revolutionizing AI application development!
Master marketing analytics using Tableau. Analyze performance, benchmark metrics, and optimize strategies across channels.