Survival Analysis in Python
Use survival analysis to work with time-to-event data and predict survival time.
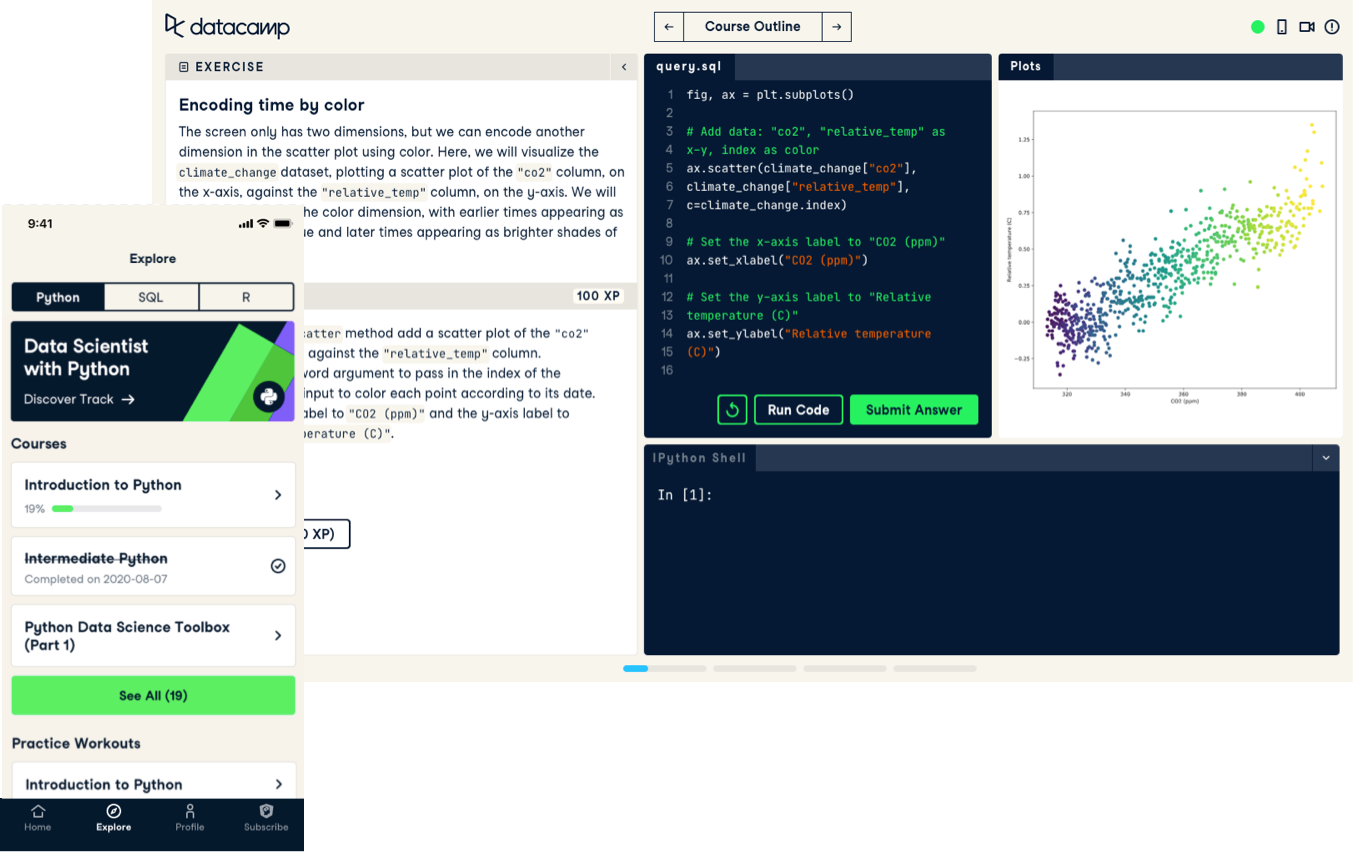
Follow short videos led by expert instructors and then practice what you’ve learned with interactive exercises in your browser.

Use survival analysis to work with time-to-event data and predict survival time.
In this course youll learn how to create static and interactive dashboards using flexdashboard and shiny.
Learn how to access financial data from local files as well as from internet sources.
Learn the principles of feature engineering for machine learning models and how to implement them using the R tidymodels framework.
Learn about MLOps, including the tools and practices needed for automating and scaling machine learning applications.
Explore HR data analysis in Tableau with this case study.
Learn to use R to develop models to evaluate and analyze bonds as well as protect them from interest rate changes.
Discover the power of discrete-event simulation in optimizing your business processes. Learn to develop digital twins using Pythons SimPy package.
Learn the fundamentals of valuing stocks.
Practice your Shiny skills while building some fun Shiny apps for real-life scenarios!
Learn all about how DataCamp builds the best platform to learn and teach data skills.
GAMs model relationships in data as nonlinear functions that are highly adaptable to different types of data science problems.
Learn how to import, clean and manipulate IoT data in Python to make it ready for machine learning.
Learn how to analyse and interpret ChIP-seq data with the help of Bioconductor using a human cancer dataset.
Learn how to use PostgreSQL to handle time series analysis effectively and apply these techniques to real-world data.
Learn dimensionality reduction techniques in R and master feature selection and extraction for your own data and models.
Gain an overview of all the skills and tools needed to excel in Natural Language Processing in R.
Unlock your datas potential by learning to detect and mitigate bias for precise analysis and reliable models.
In ecommerce, increasing sales and reducing expenses are top priorities. In this case study, youll investigate data from an online pet supply company.
Specify and fit GARCH models to forecast time-varying volatility and value-at-risk.
Practice Tableau with our healthcare case study. Analyze data, uncover efficiency insights, and build a dashboard.
Learn to rapidly visualize and explore demographic data from the United States Census Bureau using tidyverse tools.
Learn how to translate your SAS knowledge into R and analyze data using this free and powerful software language.
Learn how to use conditional formatting with your data through built-in options and by creating custom formulas.
Enhance your Tableau skills with this case study on inventory analysis. Analyze a dataset, create calculated fields, and create visualizations.
Transition from MATLAB by learning some fundamental Python concepts, and diving into the NumPy and Matplotlib packages.
Learn to analyze and model customer choice data in R.
In this course youll learn how to apply machine learning in the HR domain.
Learn about experimental design, and how to explore your data to ask and answer meaningful questions.
Fine-tune Llama for custom tasks using TorchTune, and learn techniques for efficient fine-tuning such as quantization.