Financial Trading in Python
Learn to implement custom trading strategies in Python, backtest them, and evaluate their performance!
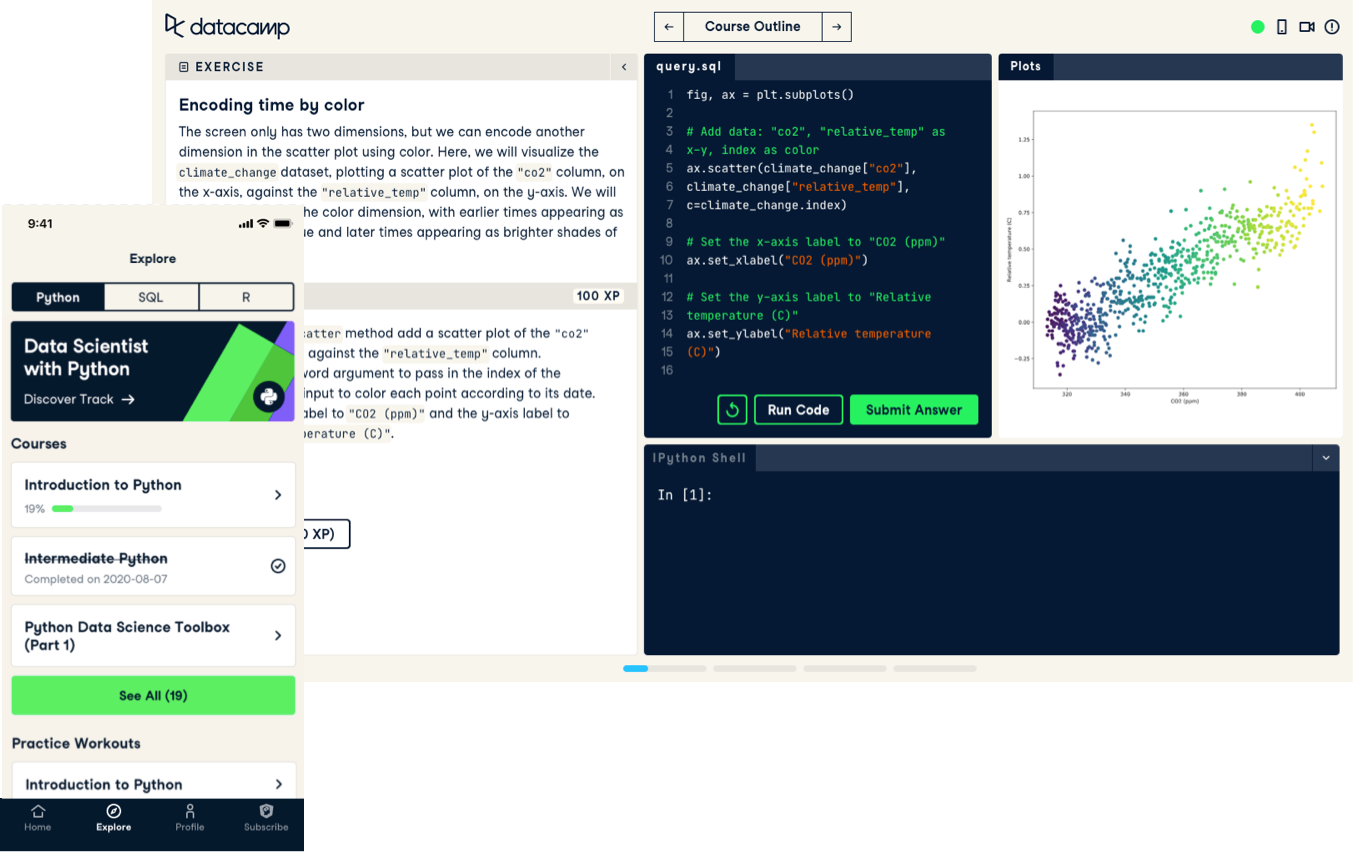
Follow short videos led by expert instructors and then practice what you’ve learned with interactive exercises in your browser.

Learn to implement custom trading strategies in Python, backtest them, and evaluate their performance!
Learn to use the KNIME Analytics Platform for data access, cleaning, and analysis with a no-code/low-code approach.
Learn how to use GPT tools responsibly and confidently. Discover how these tools work and techniques for writing prompts and evaluating outputs.
Master the key concepts of data management, from life cycle stages to security and governance.
Learn the basics of model validation, validation techniques, and begin creating validated and high performing models.
Data storytelling is a high-demand skill that elevates analytics. Learn narrative building and visualizations in this course with a college major dataset!
Learn the practical uses of A/B testing in Python to run and analyze experiments. Master p-values, sanity checks, and analysis to guide business decisions.
Take your reporting skills to the next level with Tableau’s built-in statistical functions.
Step right into the dynamic world of data modeling with Snowflake!
In this course, youll learn how to import and manage financial data in Python using various tools and sources.
Explore AI and data monetization strategies, build ethical infrastructures, and align products with business goals.
Learn about ARIMA models in Python and become an expert in time series analysis.
Master strategic data management for business excellence.
Learn to perform linear and logistic regression with multiple explanatory variables.
Learn how to build interactive and insight-rich dashboards with Dash and Plotly.
Evaluate portfolio risk and returns, construct market-cap weighted equity portfolios and learn how to forecast and hedge market risk via scenario generation.
Master the core operations of spaCy and train models for natural language processing. Extract information from unstructured data and match patterns.
Learn how to build advanced and effective machine learning models in Python using ensemble techniques such as bagging, boosting, and stacking.
Prepare for your next coding interviews in Python.
Discover the exciting world of Deep Learning for Text with PyTorch and unlock new possibilities in natural language processing and text generation.
Learn to construct compelling and attractive visualizations that help communicate results efficiently and effectively.
Get your AI Act together! Understand the obligations, risks, and requirements of the EU AI Act.
Using Python and NumPy, learn the most fundamental financial concepts.
Discover how to become a data defender and keep data safe and secure with this beginner-friendly interactive course.
Use Seaborns sophisticated visualization tools to make beautiful, informative visualizations with ease.
Learn how to make attractive visualizations of geospatial data in Python using the geopandas package and folium maps.
Learn how to make predictions from data with Apache Spark, using decision trees, logistic regression, linear regression, ensembles, and pipelines.
Elevate decision-making skills with Decision Models, analysis methods, risk management, and optimization techniques.
Learn all about the advantages of Bayesian data analysis, and apply it to a variety of real-world use cases!
Discover different types in data modeling, including for prediction, and learn how to conduct linear regression and model assessment measures in the Tidyverse.