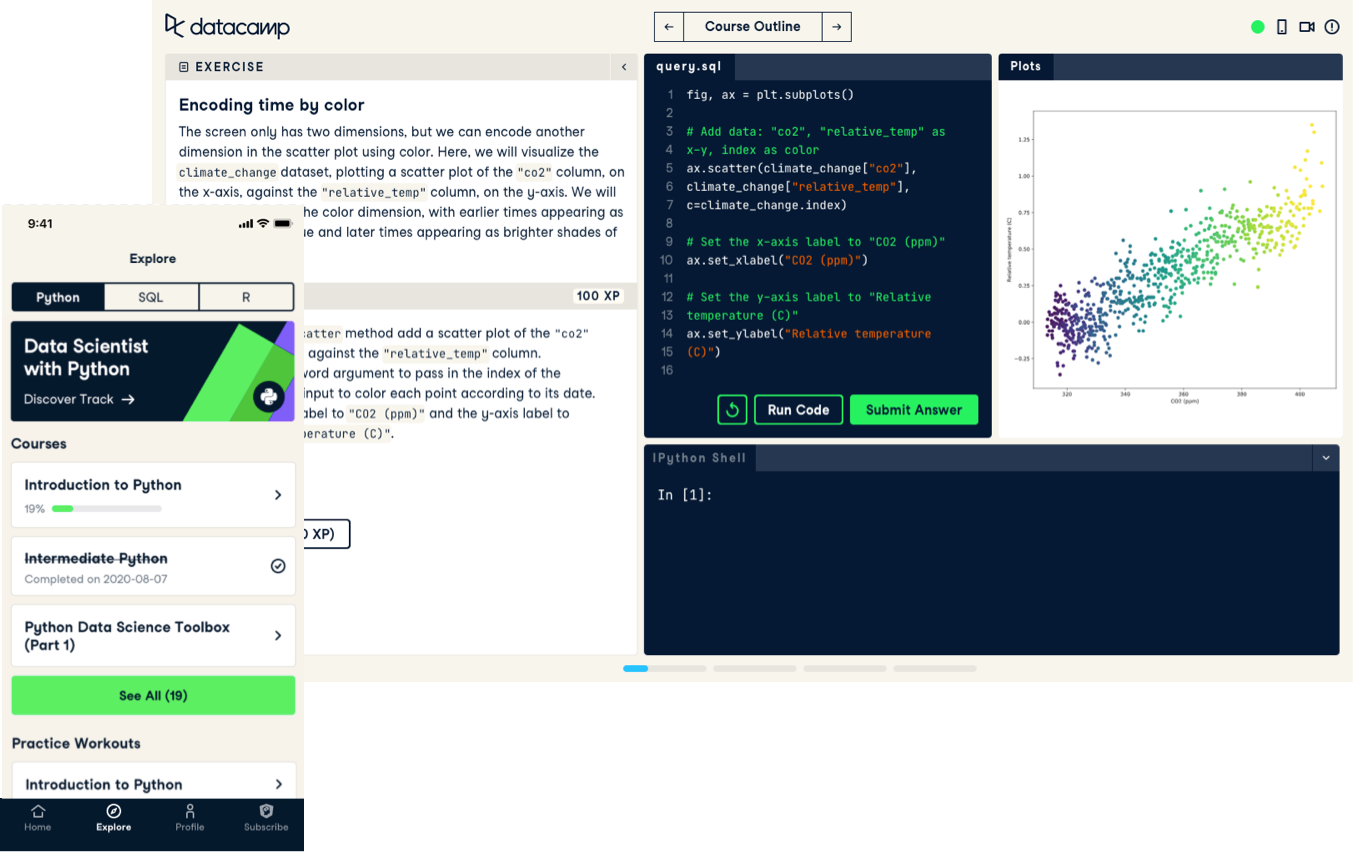
Exploratory Data Analysis in Python
Learn how to explore, visualize, and extract insights from data using exploratory data analysis (EDA) in Python.
Follow short videos led by expert instructors and then practice what you’ve learned with interactive exercises in your browser.

Learn how to explore, visualize, and extract insights from data using exploratory data analysis (EDA) in Python.
Learn how to explore whats available in a database: the tables, relationships between them, and data stored in them.
Learn how to build impactful reports with Power BI’s Exploratory Data Analysis (EDA) that uncover insights faster and drive business value.
Learn how to use graphical and numerical techniques to begin uncovering the structure of your data.
Build up your pandas skills and answer marketing questions by merging, slicing, visualizing, and more!
Use data manipulation and visualization skills to explore the historical voting of the United Nations General Assembly.
Leverage the power of Python and PuLP to optimize supply chains.
Learn how to use Python to analyze customer churn and build a model to predict it.
Learn to use the Census API to work with demographic and socioeconomic data.
Learn how to manipulate, visualize, and perform statistical tests through a series of HR analytics case studies.
Learn to rapidly visualize and explore demographic data from the United States Census Bureau using tidyverse tools.