IA Generativa para Empresas
Descubre el papel de la Inteligencia Artificial Generativa en el entorno empresarial actual y futuro.
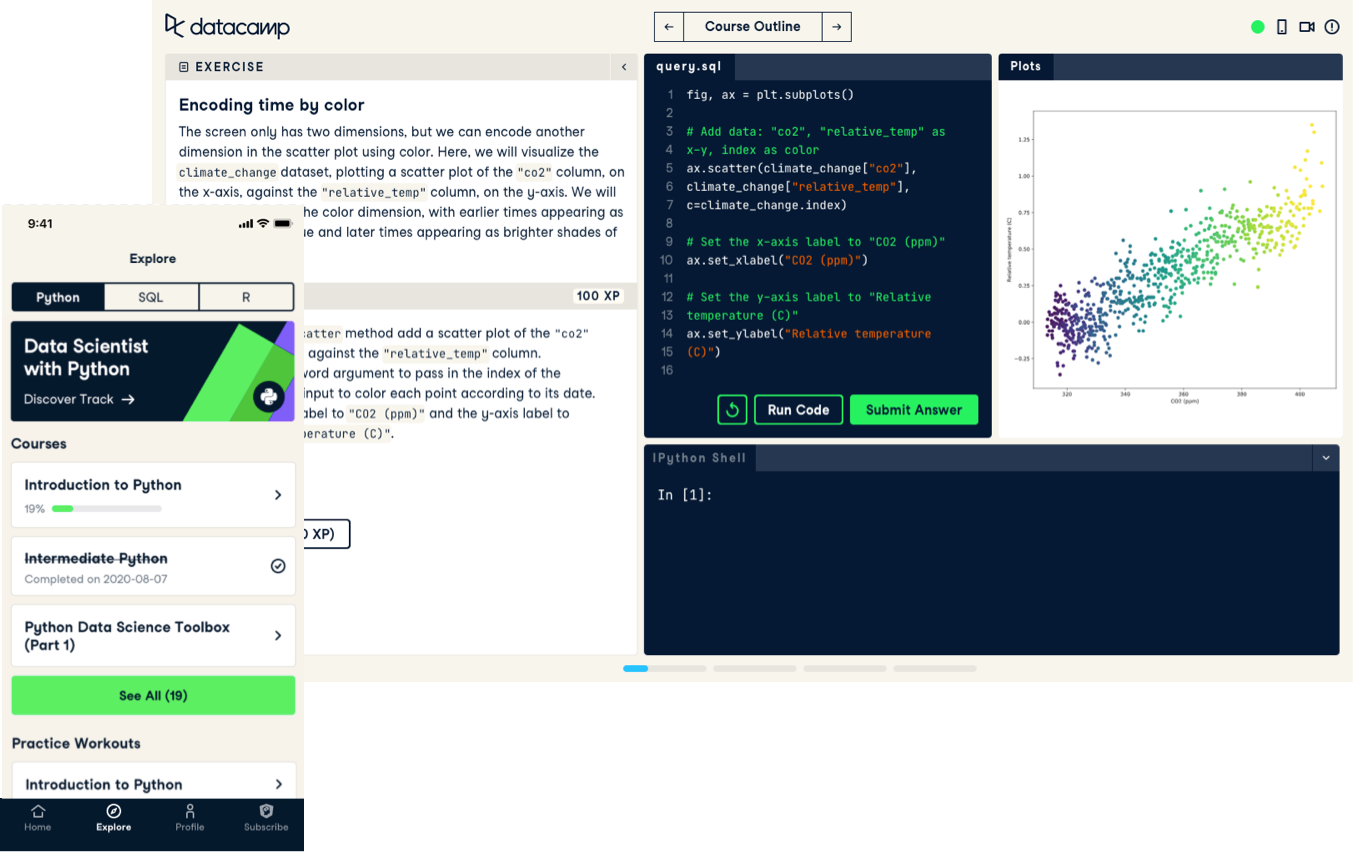
Siga videos cortos dirigidos por instructores expertos y luego practique lo que ha aprendido con ejercicios interactivos en su navegador.

Descubre el papel de la Inteligencia Artificial Generativa en el entorno empresarial actual y futuro.
Learn how and when to use hypothesis testing in R, including t-tests, proportion tests, and chi-square tests.
En este curso, aprenderás los fundamentos de Kubernetes y a desplegar contenedores con Manifests y kubectl.
En este curso aprenderás los fundamentos del aprendizaje automático para clasificación.
Mejora tus informes con técnicas de análisis de tendencias como series temporales y árboles de descomposición.
Continúa tu viaje de visualización de datos aprendiendo técnicas prácticas de DAX y divulgación progresiva.
Aprende a usar facetas, sistemas de coordenadas y estadísticas en ggplot2 para crear gráficos explicativos.
Master Apache Kafka! From core concepts to advanced architecture, learn to create, manage, and troubleshoot Kafka for real-world data streaming challenges!
Learn to connect Tableau to different data sources and prepare the data for a smooth analysis.
Implementa diseños experimentales y realiza análisis estadísticos robustos para conclusiones precisas y válidas.
Descubre el poder de Databricks Lakehouse y mejora tus habilidades en ingeniería de datos y aprendizaje automático.
En este curso aprenderás los detalles de clasificadores lineales como la regresión logística y SVM.
Learn how to deploy and maintain assets in Power BI. You’ll get to grips with the Power BI Service interface and key elements in it like workspaces.
Learn to acquire data from common file formats and systems such as CSV files, spreadsheets, JSON, SQL databases, and APIs.
Aprende a realizar regresión lineal y logística con múltiples variables explicativas.
Learn essential data structures such as lists and data frames and apply that knowledge directly to financial examples.
Explora la ética de datos con este curso introductorio, cubriendo principios, ética de IA y habilidades prácticas.
Apply PyTorch to images and use deep learning models for object detection with bounding boxes and image segmentation generation.
Descubre cómo tomar mejores decisiones empresariales aplicando marcos de datos prácticos, sin programación.
Find tables, store and manage new tables and views, and write maintainable SQL code to answer business questions.
Expand your Google Sheets vocabulary by diving deeper into data types, including numeric data, logical data, and missing data.
R Markdown is an easy-to-use formatting language for authoring dynamic reports from R code.
Gain an introduction to data governance, exploring its meaning, purpose, and how to implement a data governance framework.
In this course, you will use T-SQL, the flavor of SQL used in Microsofts SQL Server for data analysis.
Master Power Pivot in Excel to help import data, create relationships, and utilize DAX. Build dynamic dashboards to uncover actionable insights.
Transform almost any dataset into a tidy format to make analysis easier.
Navigate and use the extensive repository of models and datasets available on the Hugging Face Hub.
Desbloquea aplicaciones avanzadas de IA, como búsqueda semántica y motores de recomendación, con el modelo de OpenAI.
Unlock BigQuerys power: grasp its fundamentals, execute queries, and optimize workflows for efficient data analysis.
En este curso, aprenderás sobre aprendizaje no supervisado con técnicas como clustering jerárquico y k-means usando SciPy.